Key figures 2024
An overview of the most important figures for 2024 is listed here.
You can find the complete annual report for 2024 here (only in Dutch).
MLSO key indicators: Concessions in 2024
Ground leasing-concessions ratio (in m2). A few new concessions were awarded in recent years.
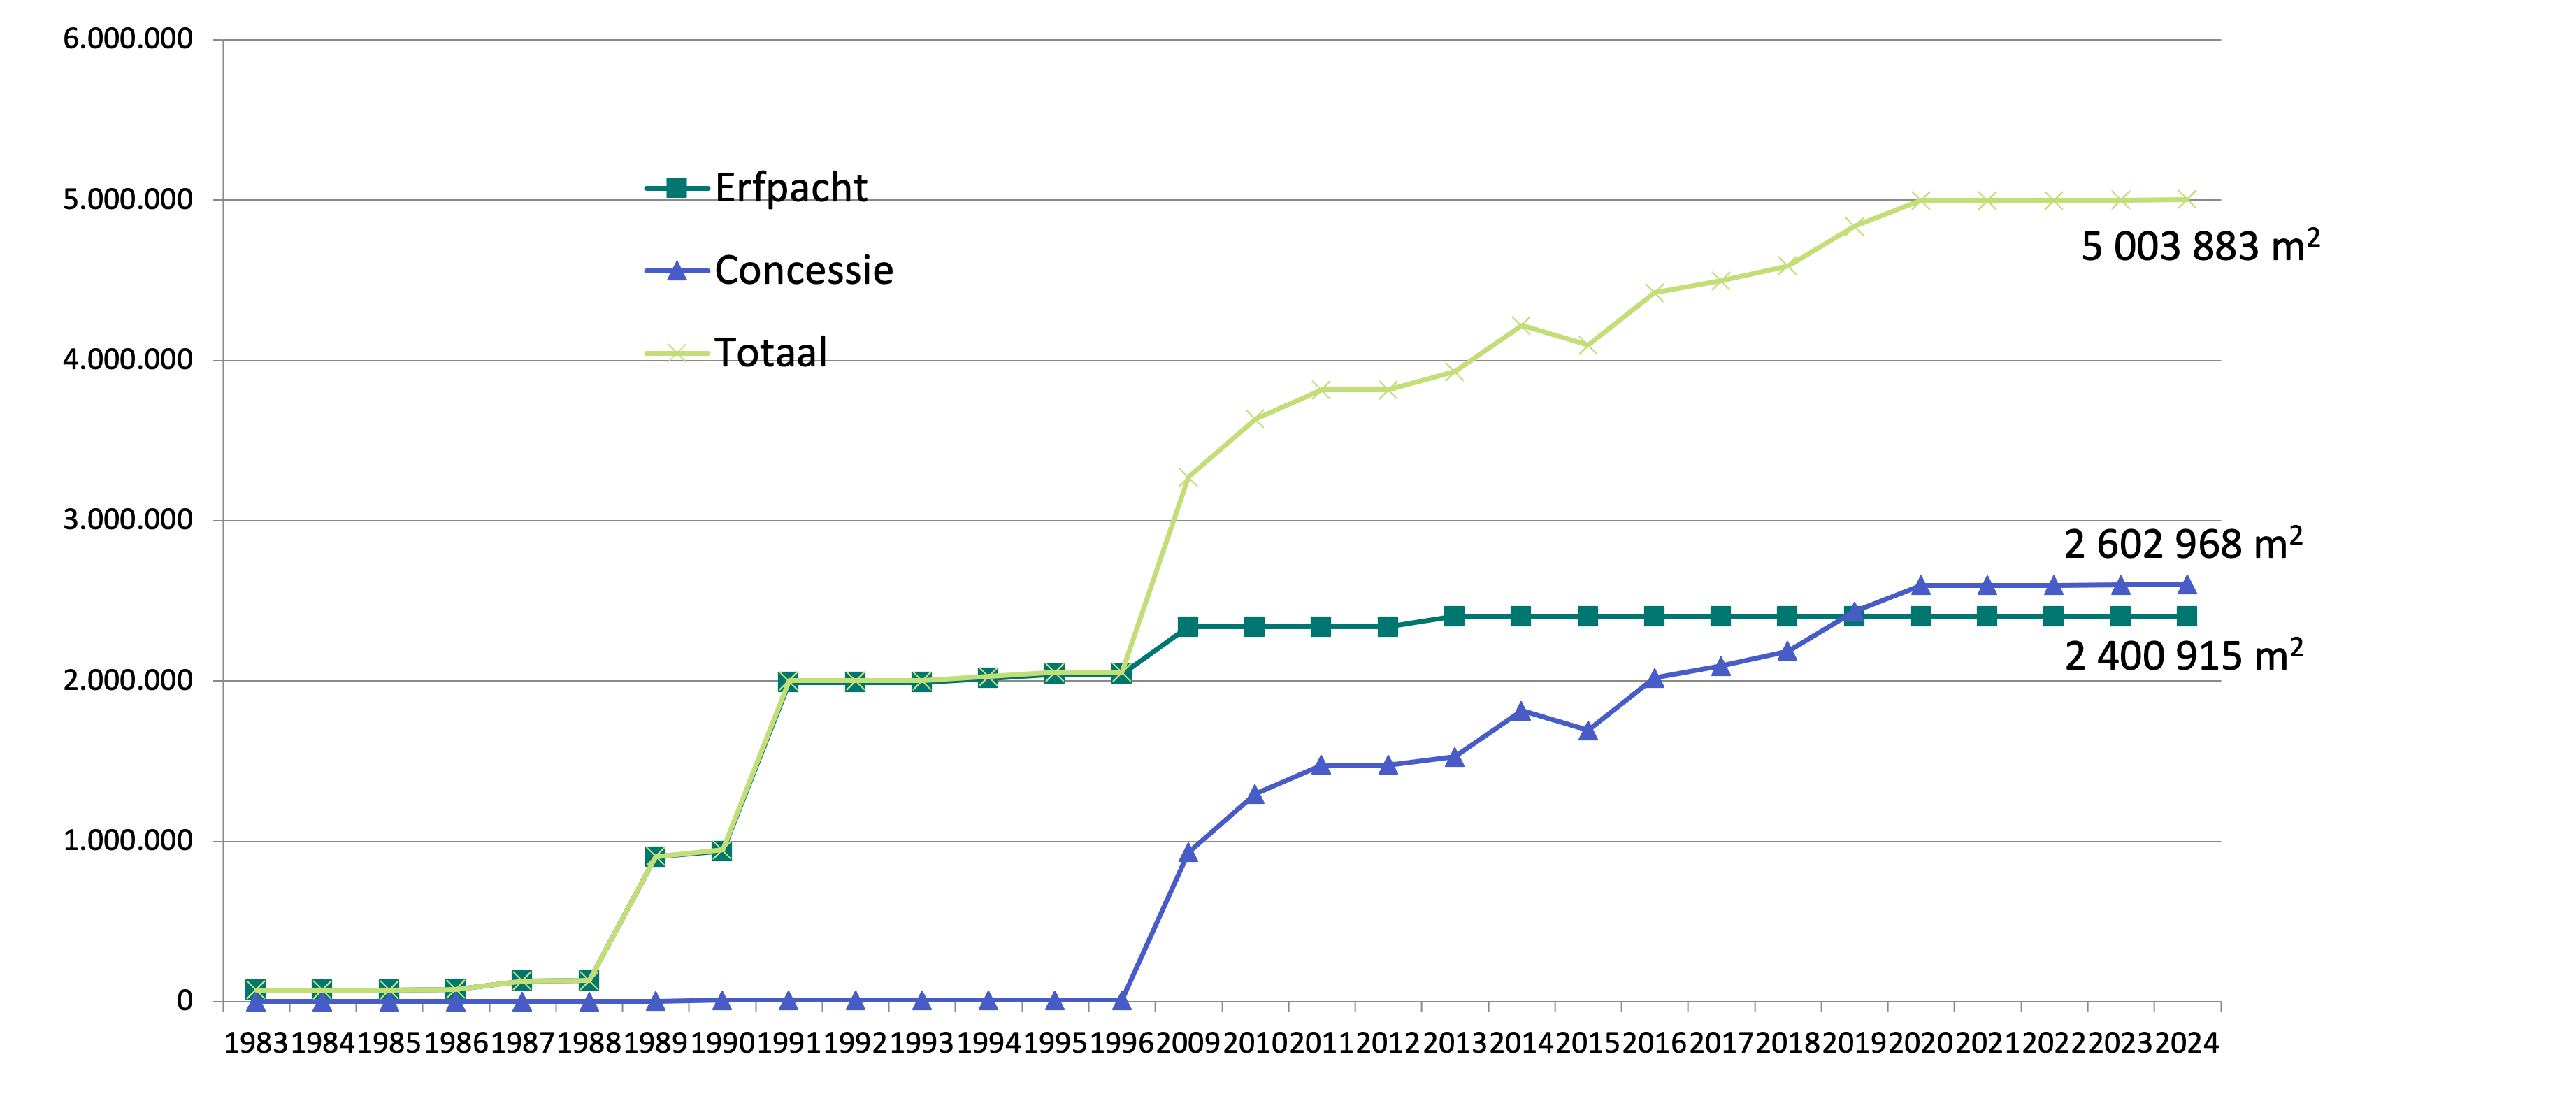
Verhouding_concessies_erfpacht/Ground leasing-concessions ratio
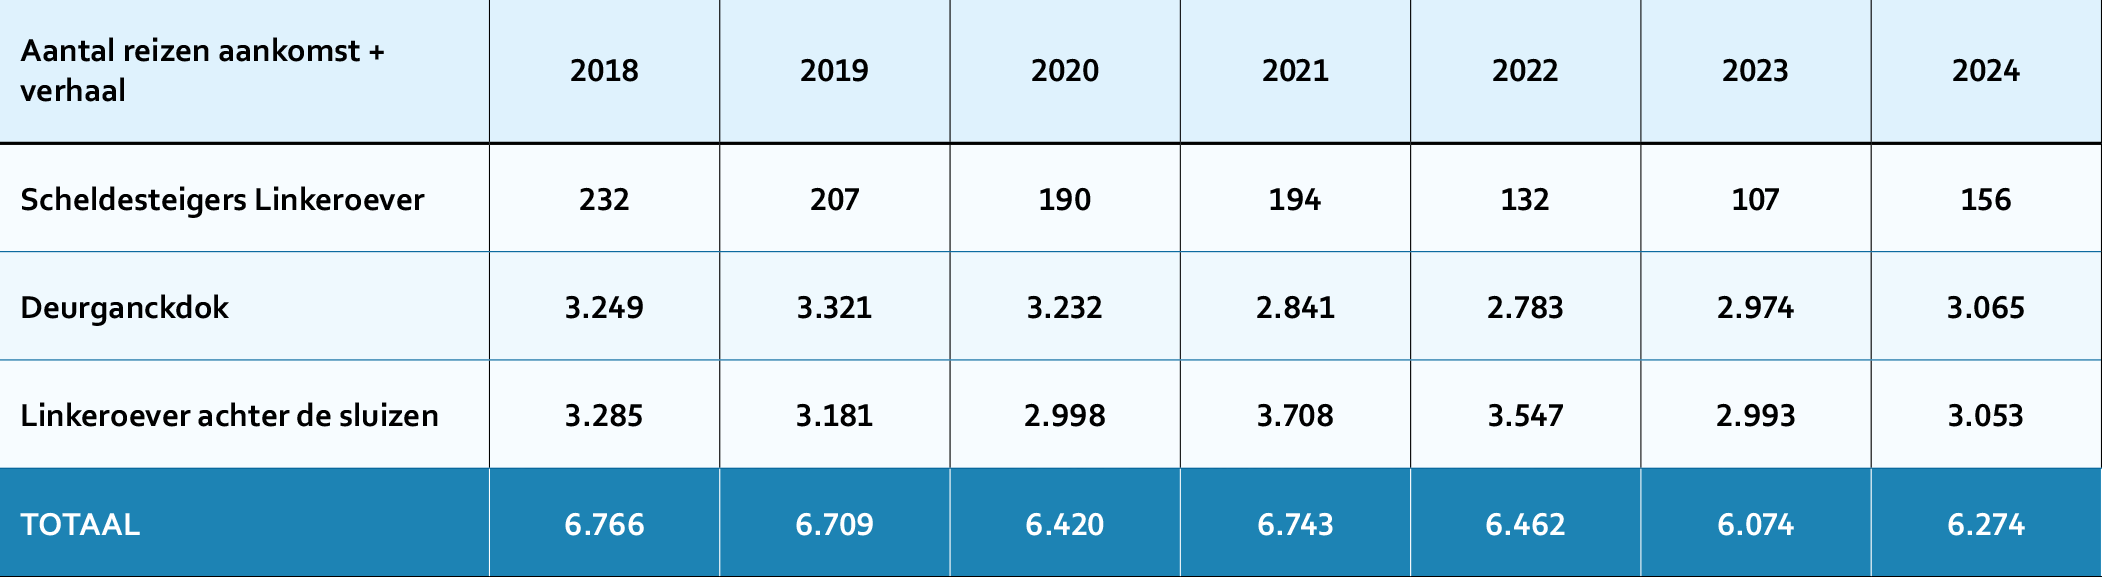
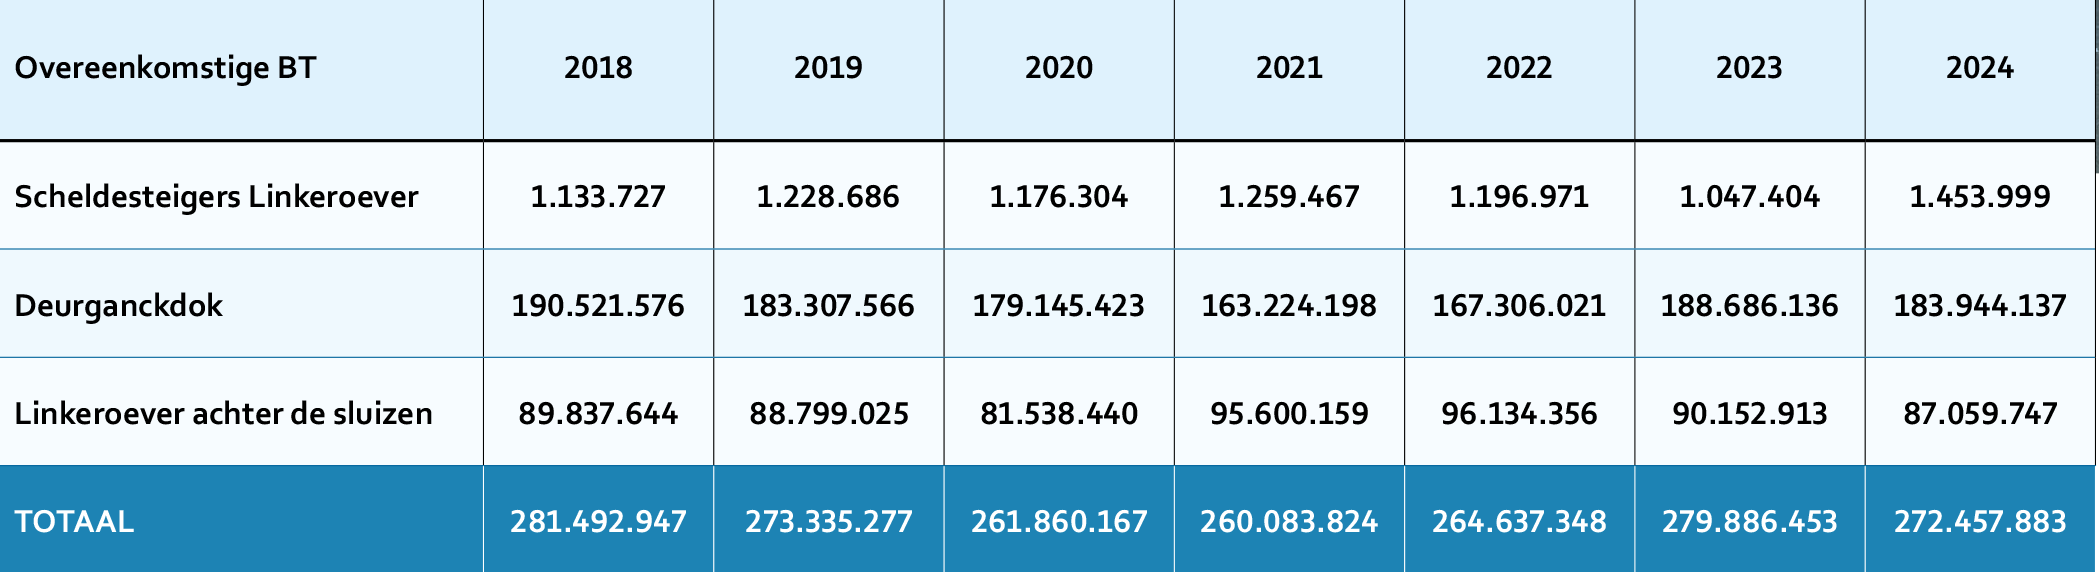
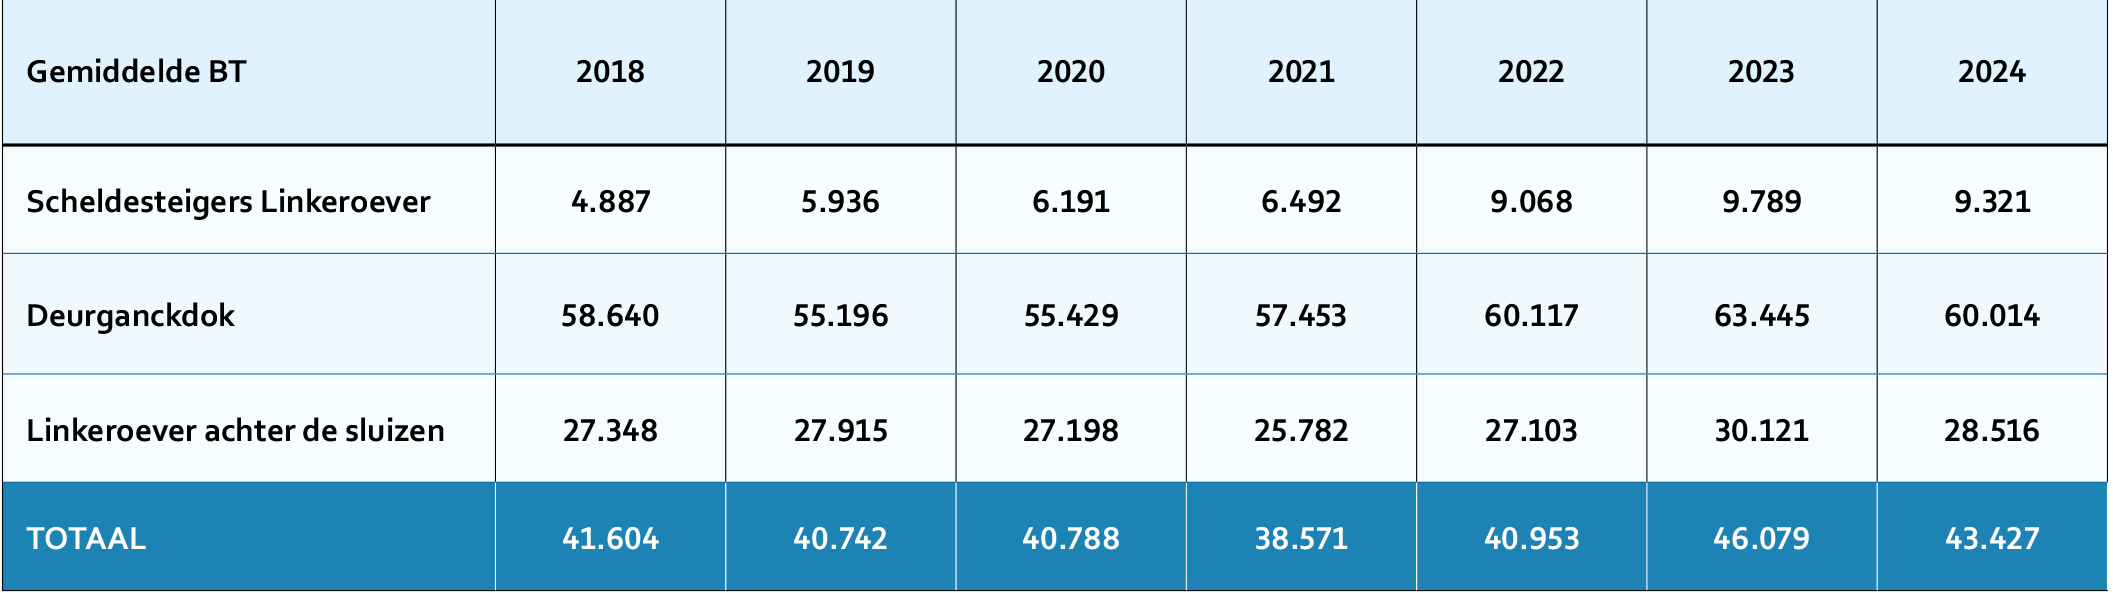
Left bank - shipping traffic figures in 2024
Left bank: number of seagoing vessels in 2024.
Ratio of the Scheldt quays (left bank) - left bank behind the locks - Deurganckdok (dock)
Aantal zeeschepen aankomst (Waaslandhaven) - 1/3 / Number of seagoing vessels (left bank of the Scheldt) - 1/3
Aantal zeeschepen aankomst (Waaslandhaven) - 2/3 / Number of seagoing vessels (left bank of the Scheldt) - 2/3
Aantal zeeschepen aankomst (Waaslandhaven) - 3/3 / Number of seagoing vessels (left bank of the Scheldt) - 3/3
Left bank - inland shipping traffic figures in 2024
Left bank: inland shipping in 2024.
Ratio of the Scheldt quays (left bank) - left bank behind the locks - Deurganckdok (dock)
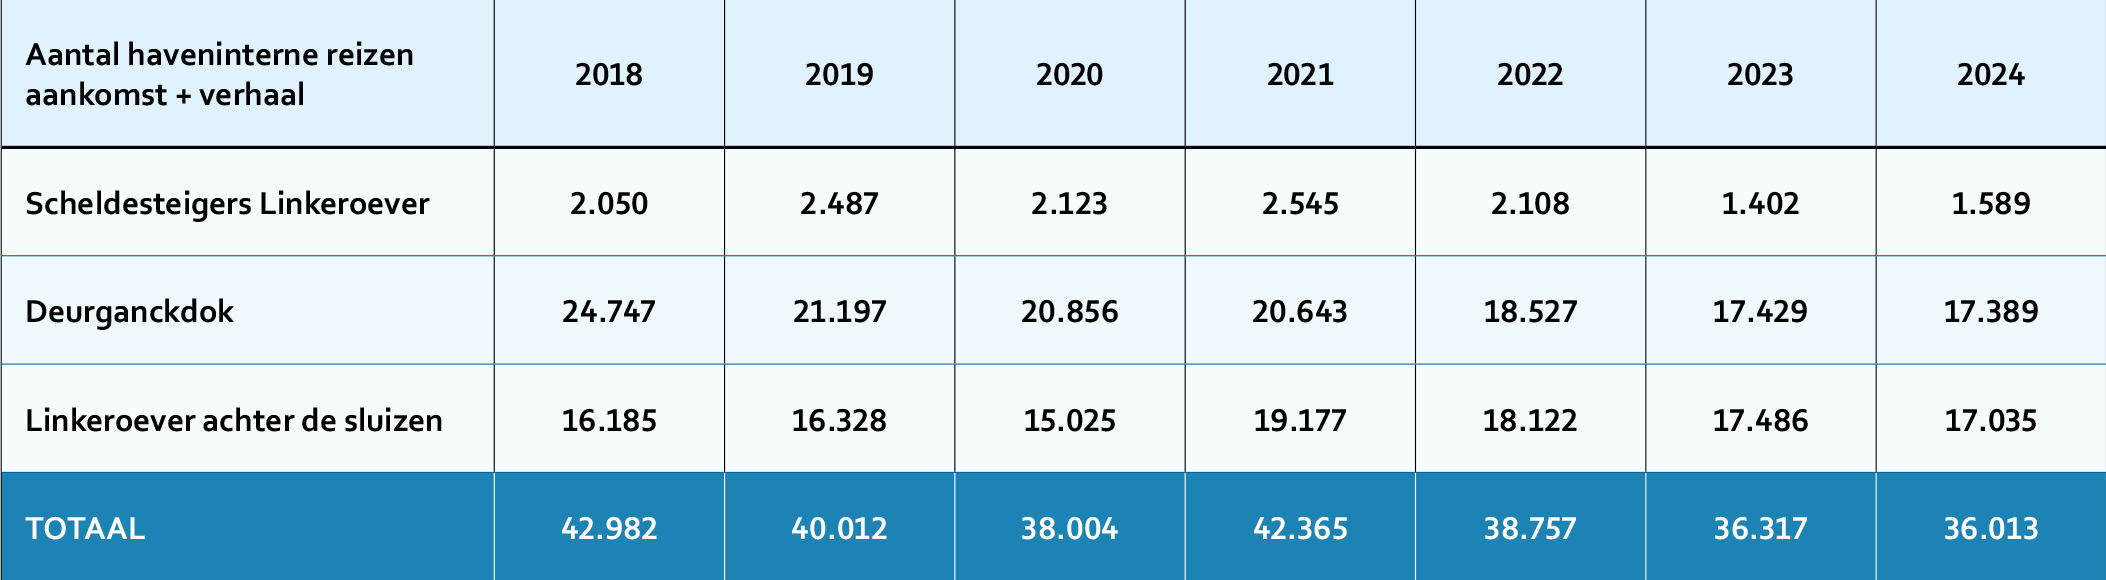
Binnenvaart Linkeroever: haveninterne reizen (ton) - 1/3 / Left bank inland shipping: port internal traffic (tonnes) - 1/3
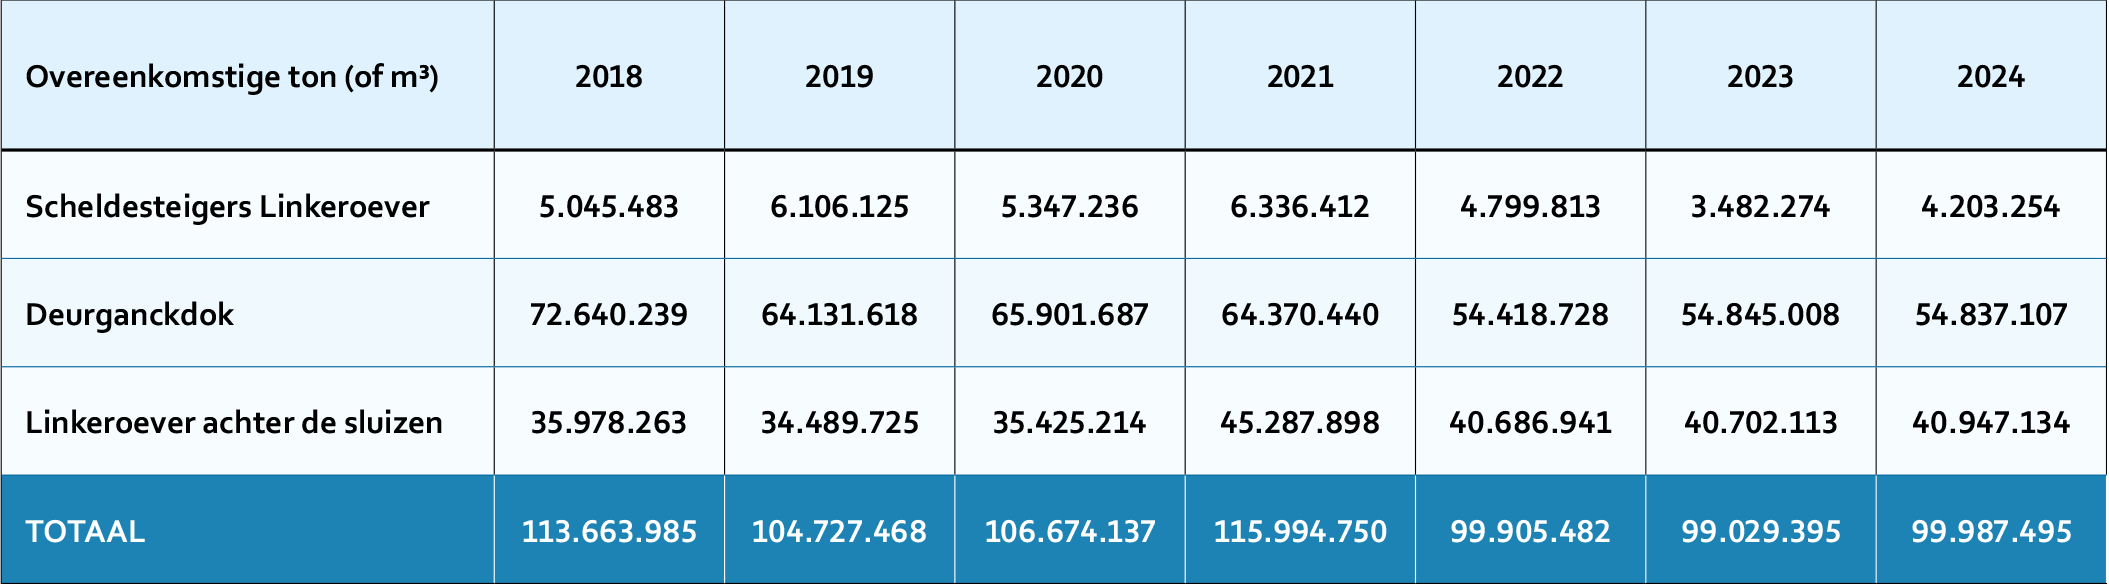
Binnenvaart Linkeroever: haveninterne reizen (ton) - 2/3 / Left bank inland shipping: port internal traffic (tonnes) - 2/3
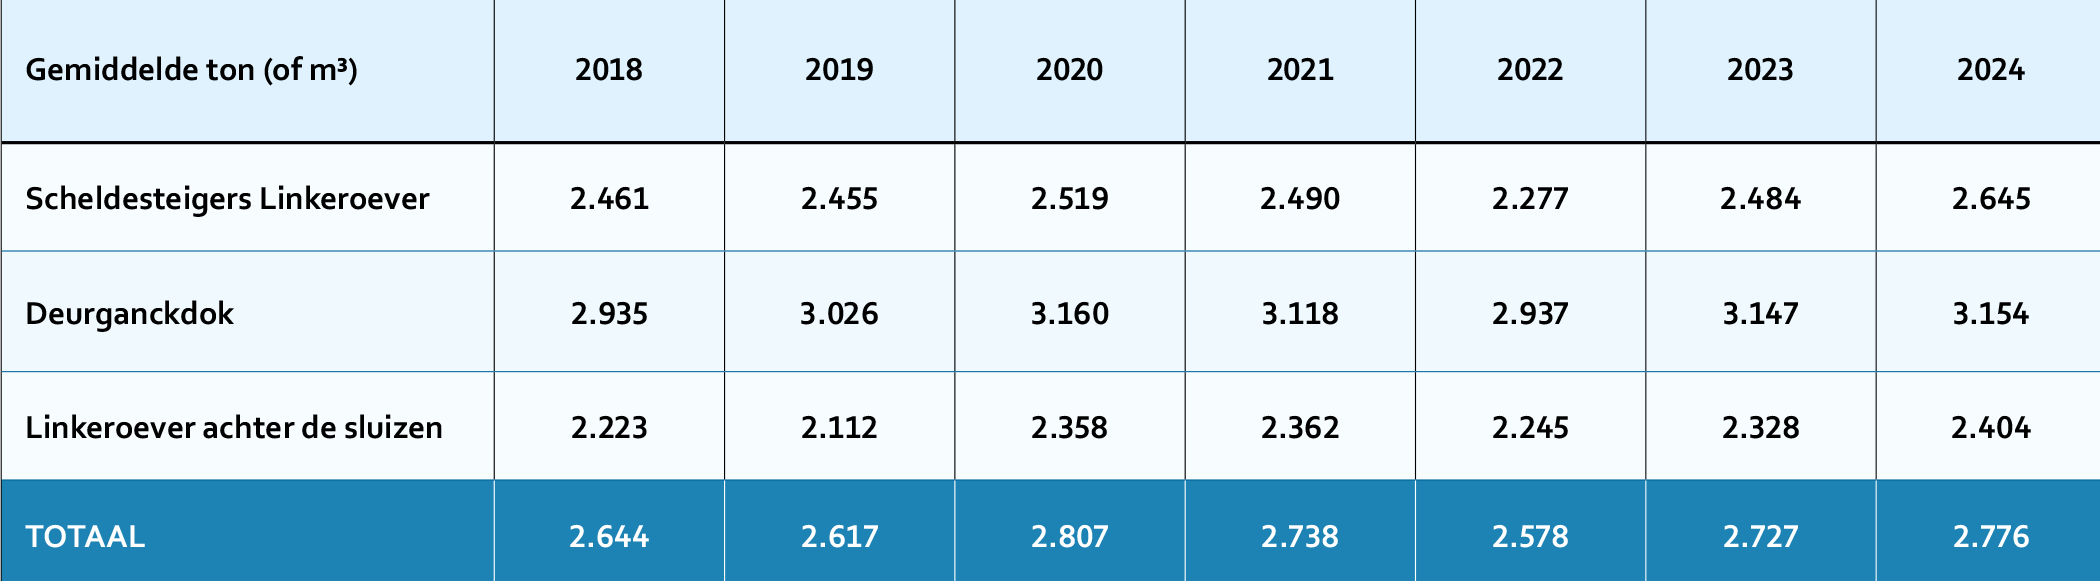
Binnenvaart Linkeroever: haveninterne reizen (ton) - 3/3 / Left bank inland shipping: port internal traffic (tonnes) - 3/3
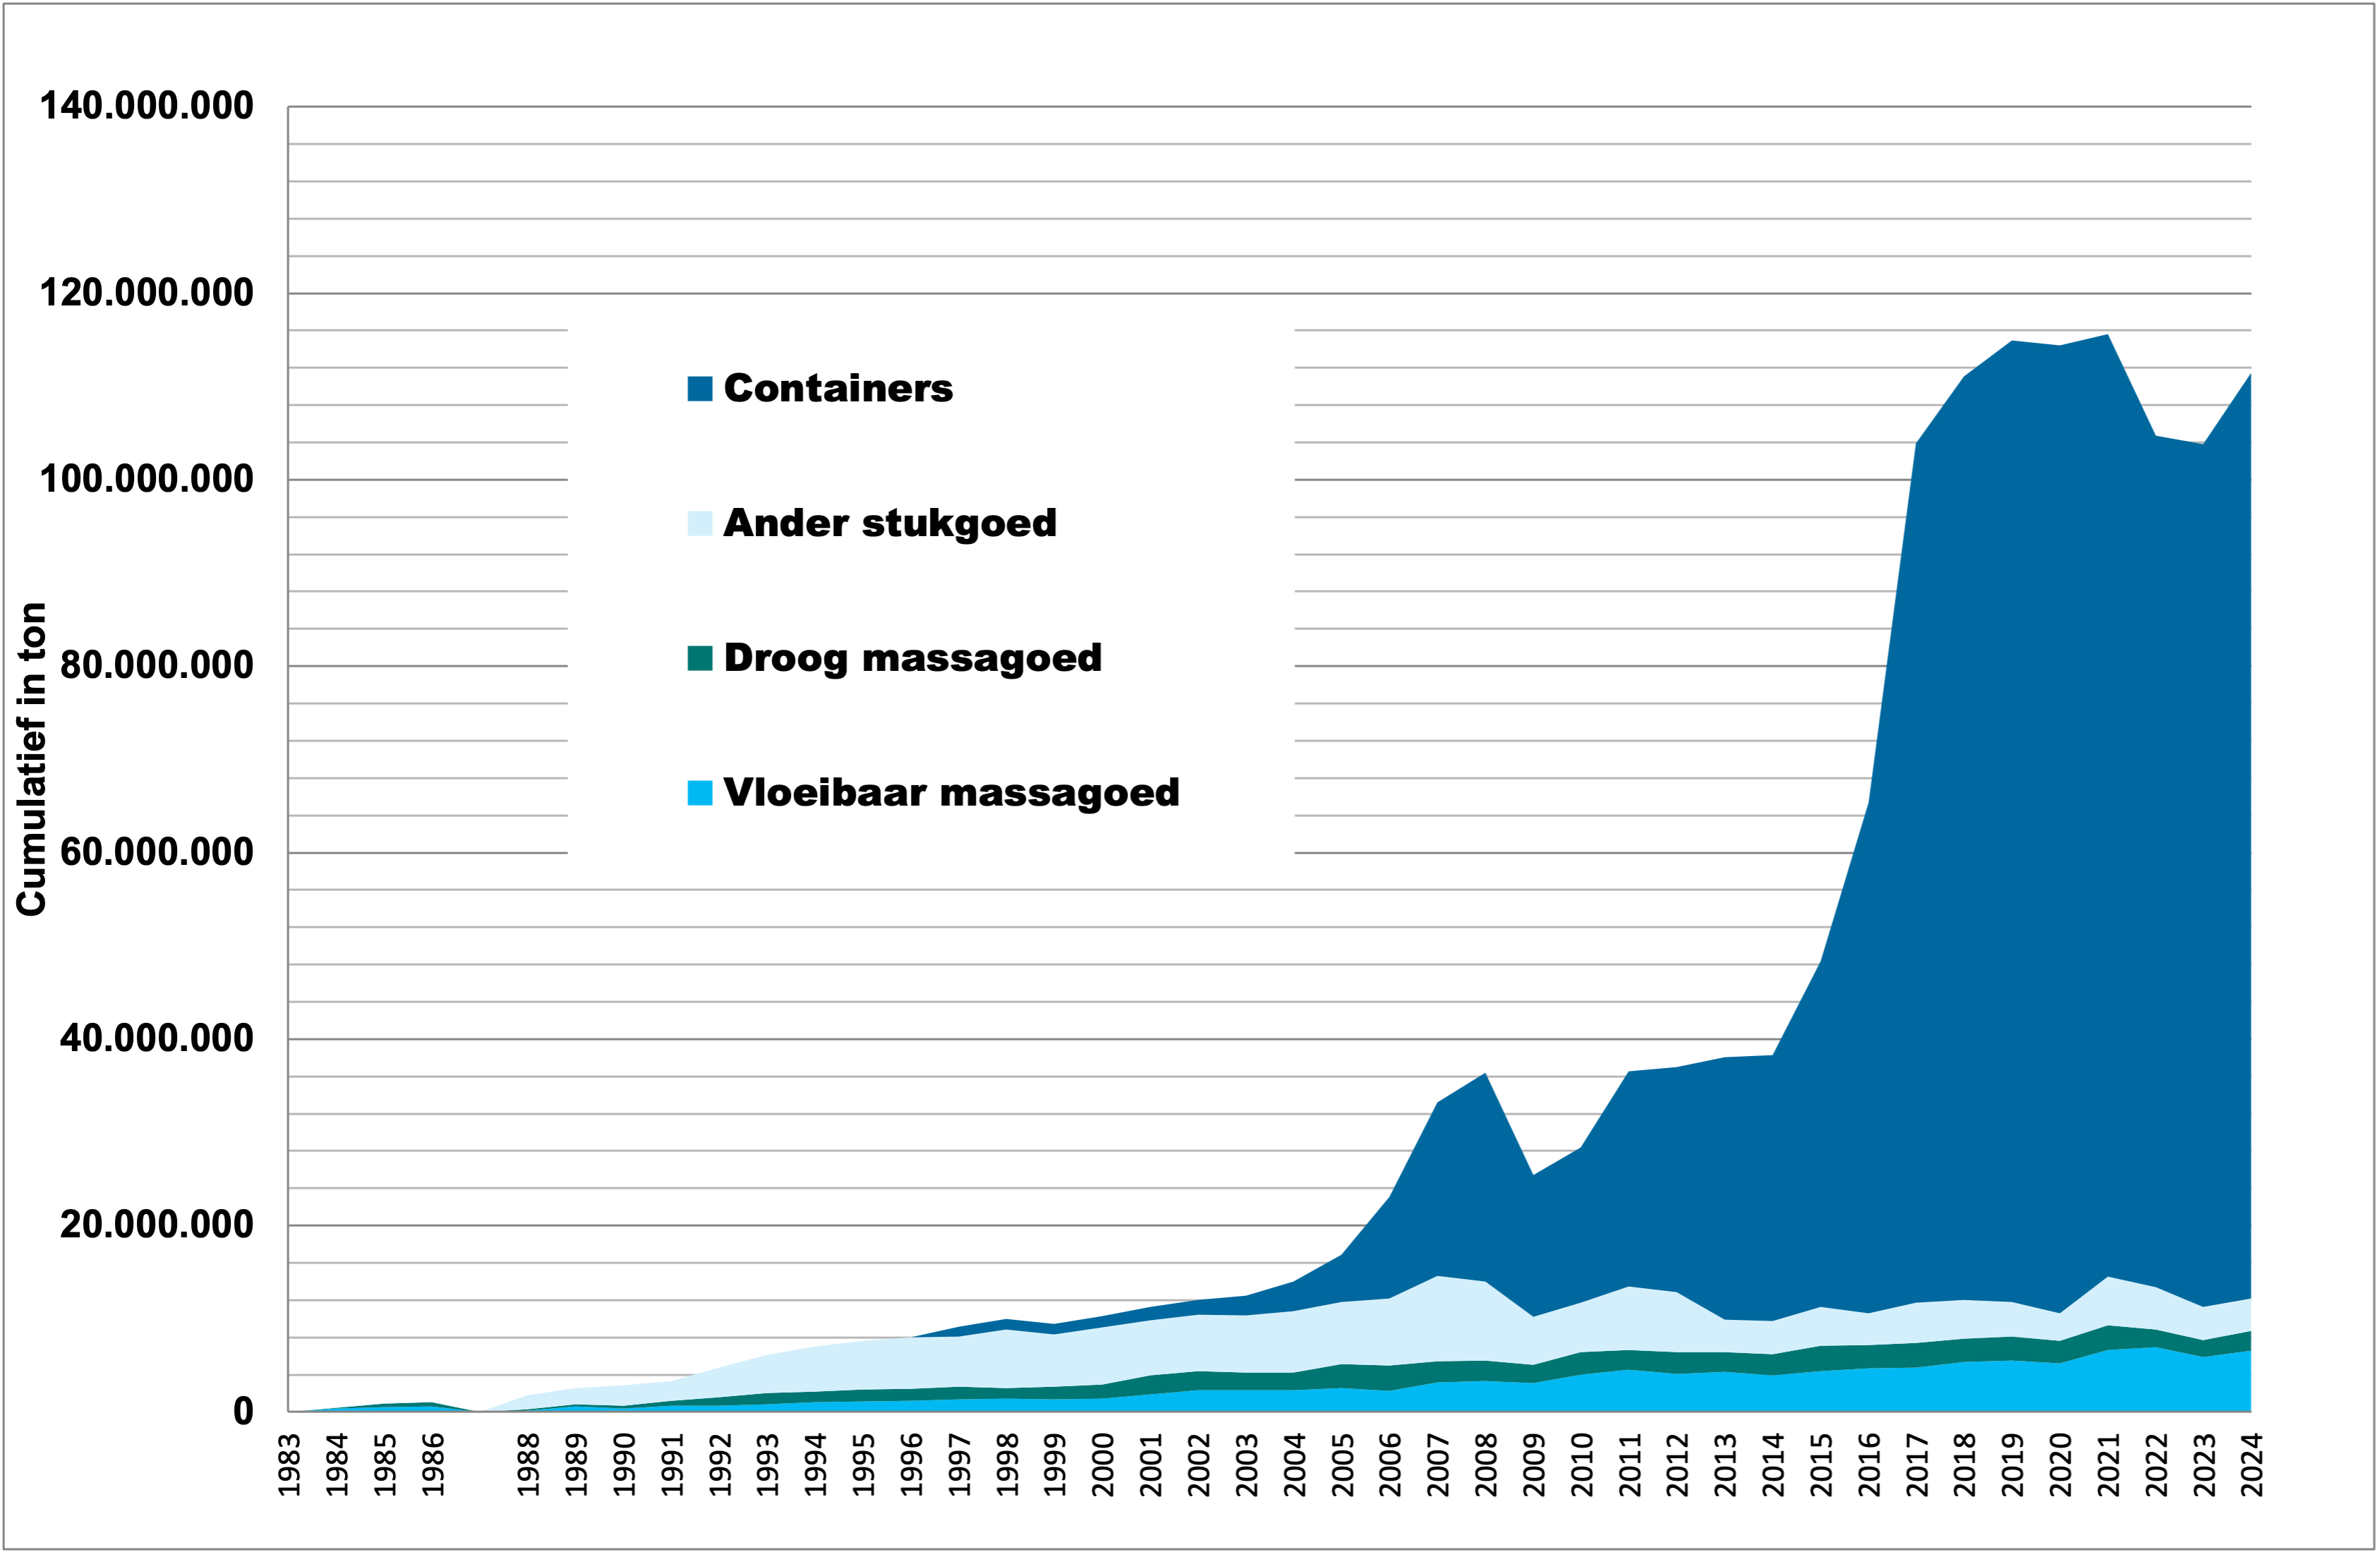
Left bank – freight traffic in 2024
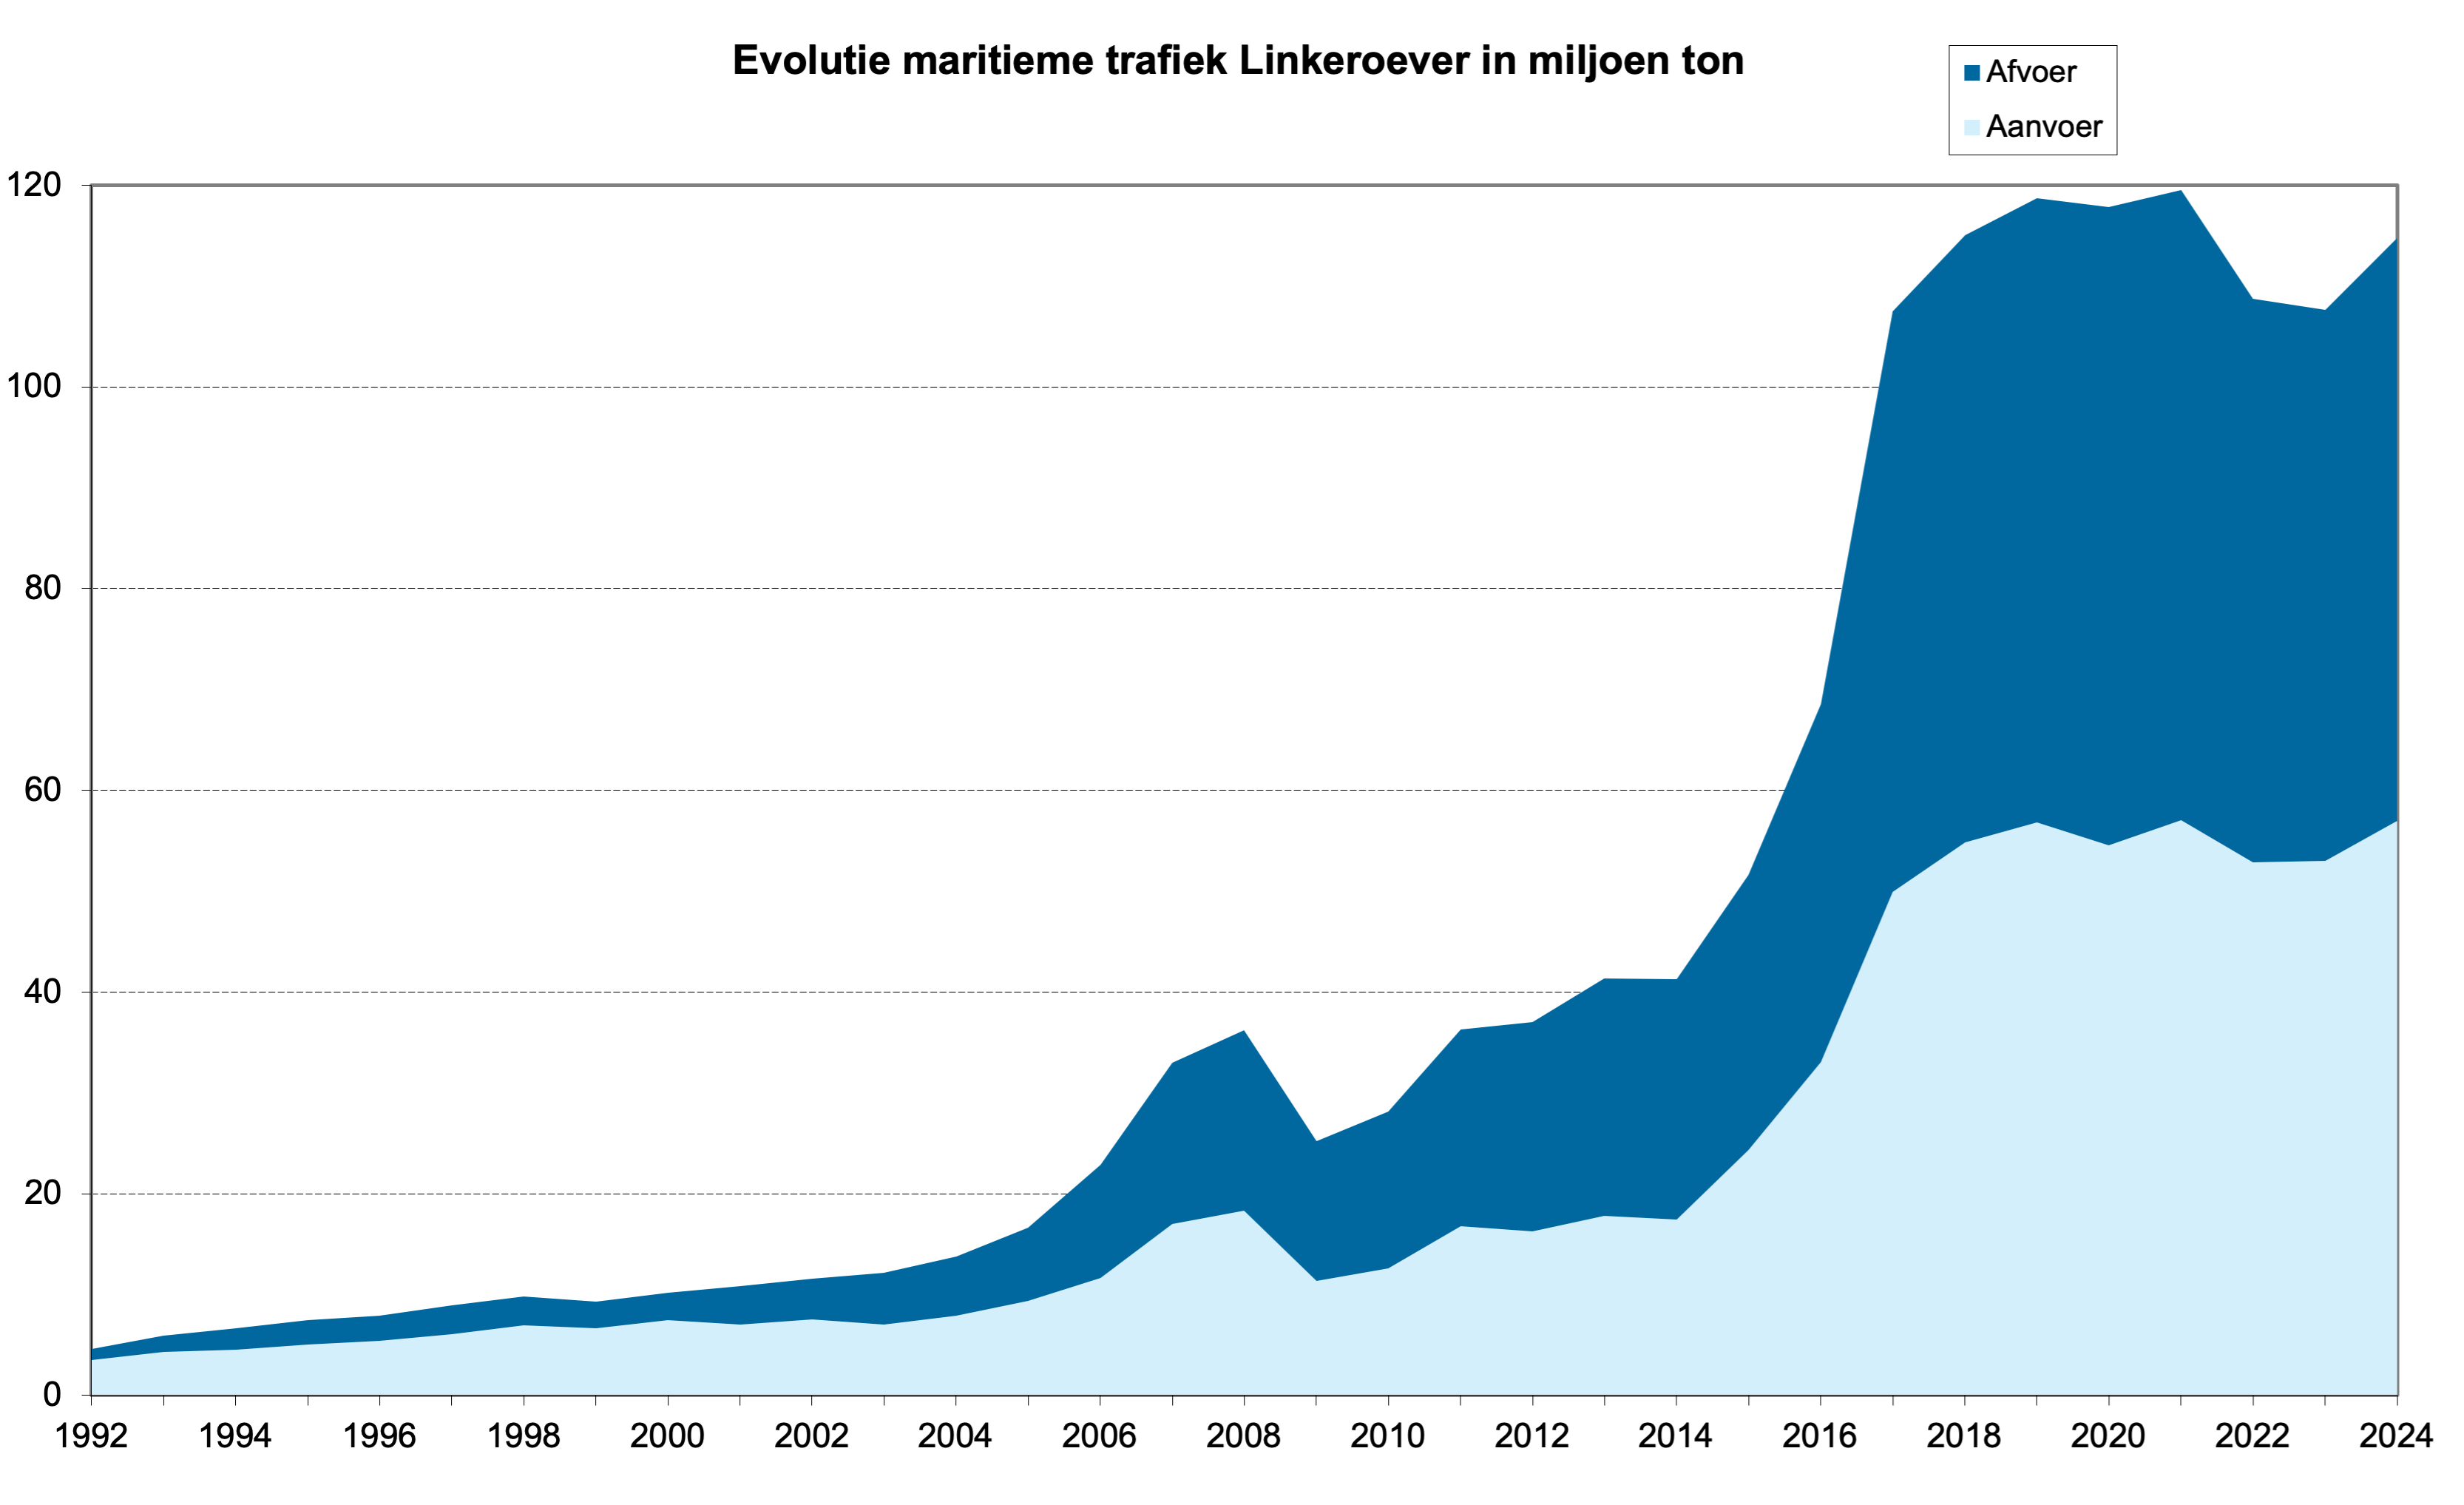
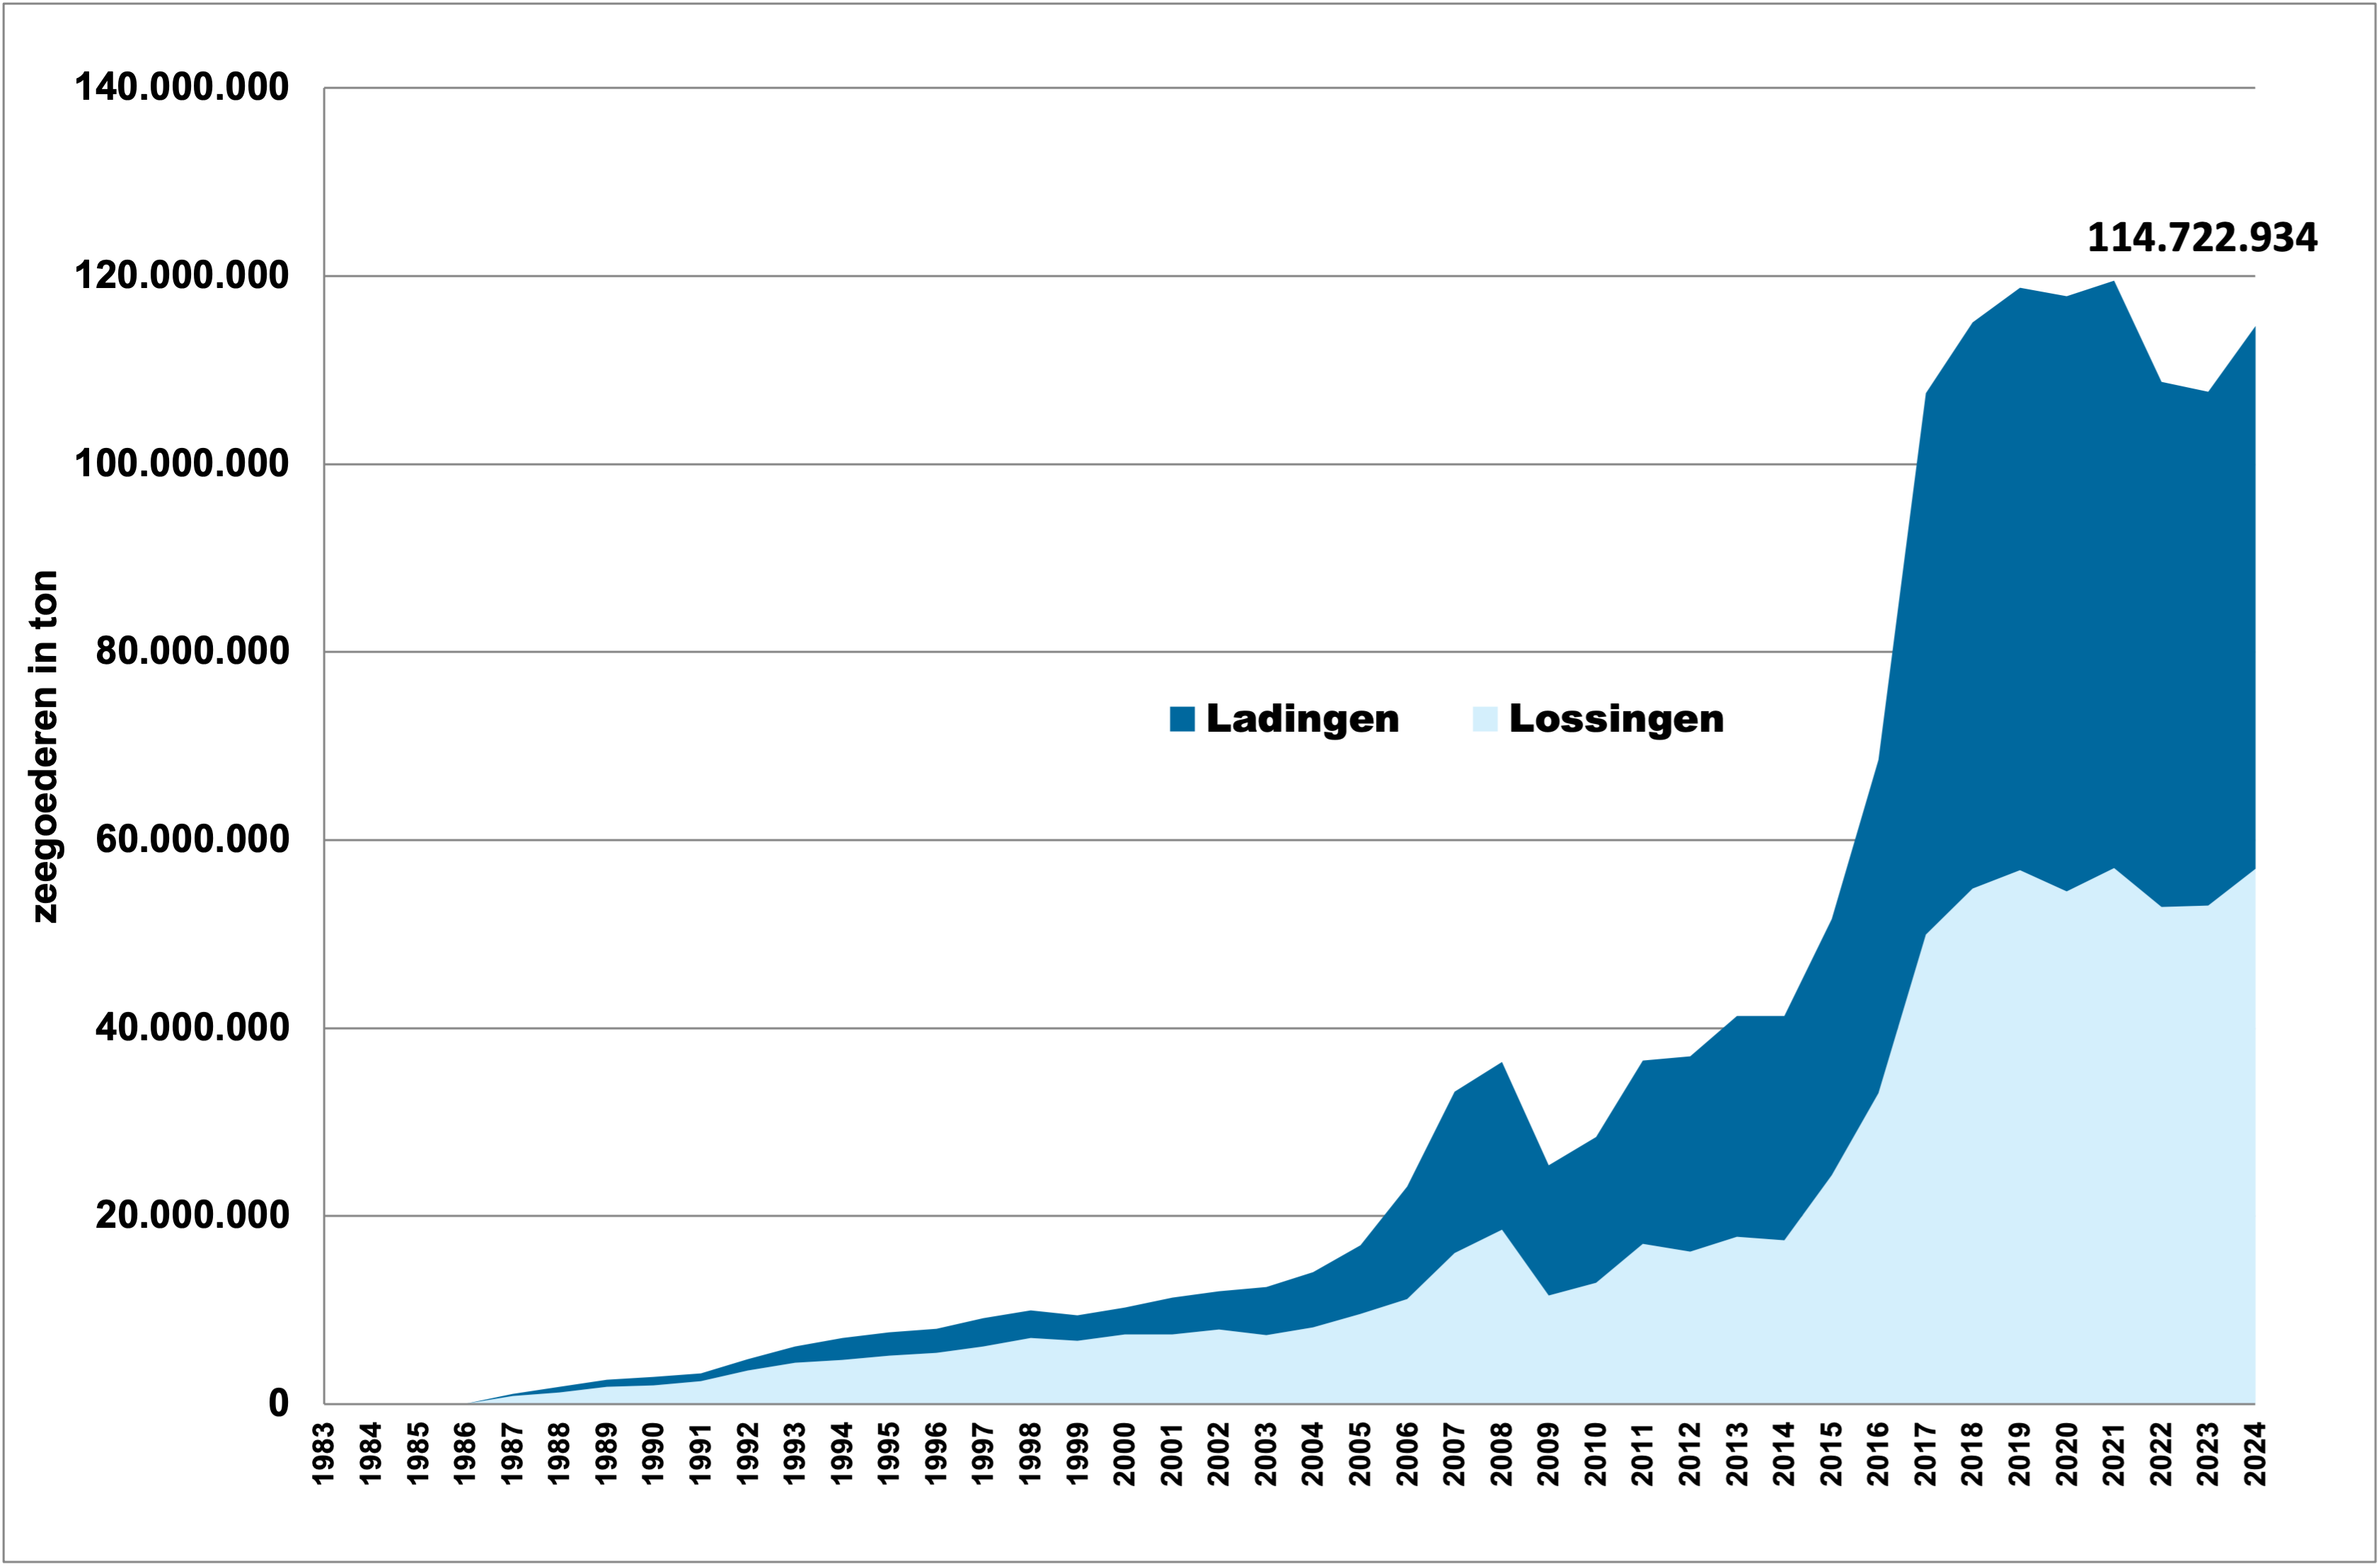
Evolutie maritieme trafiek LSO (miljoen ton) / Evolution of Maritime traffic in the left bank (million tonnes)
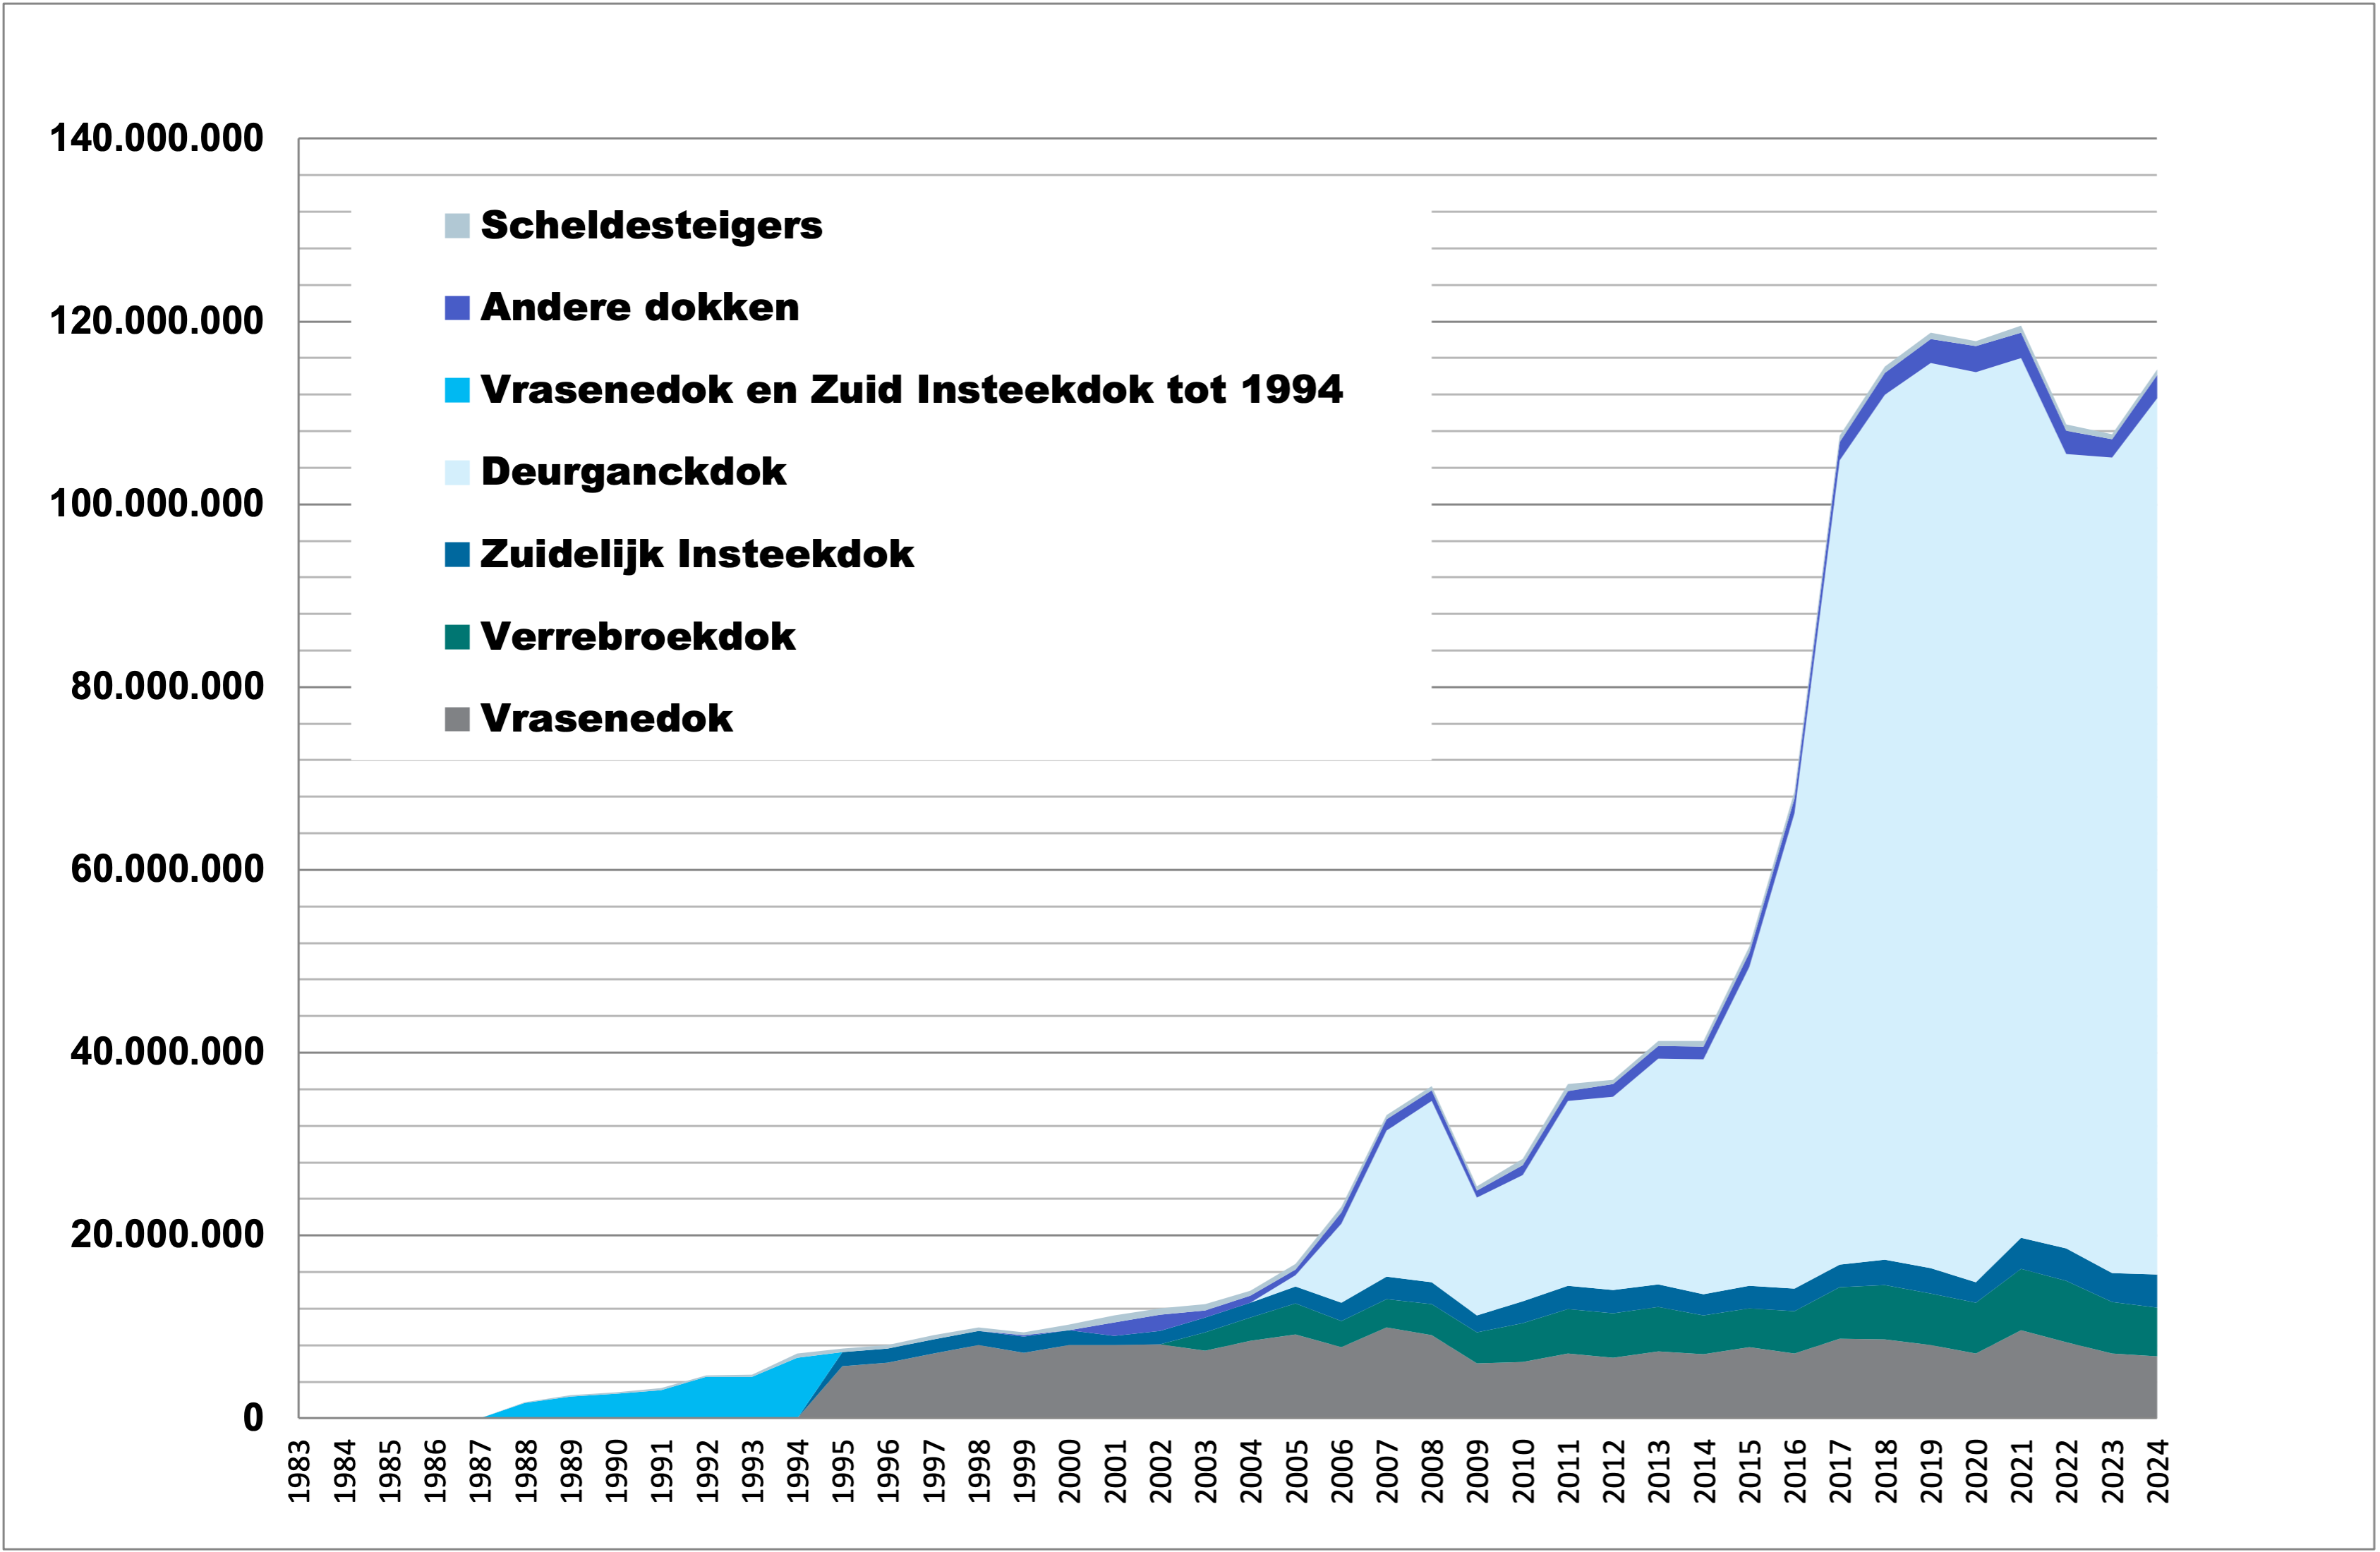
Goederen per dok (Waaslandhaven) / Goods per dock (left bank)
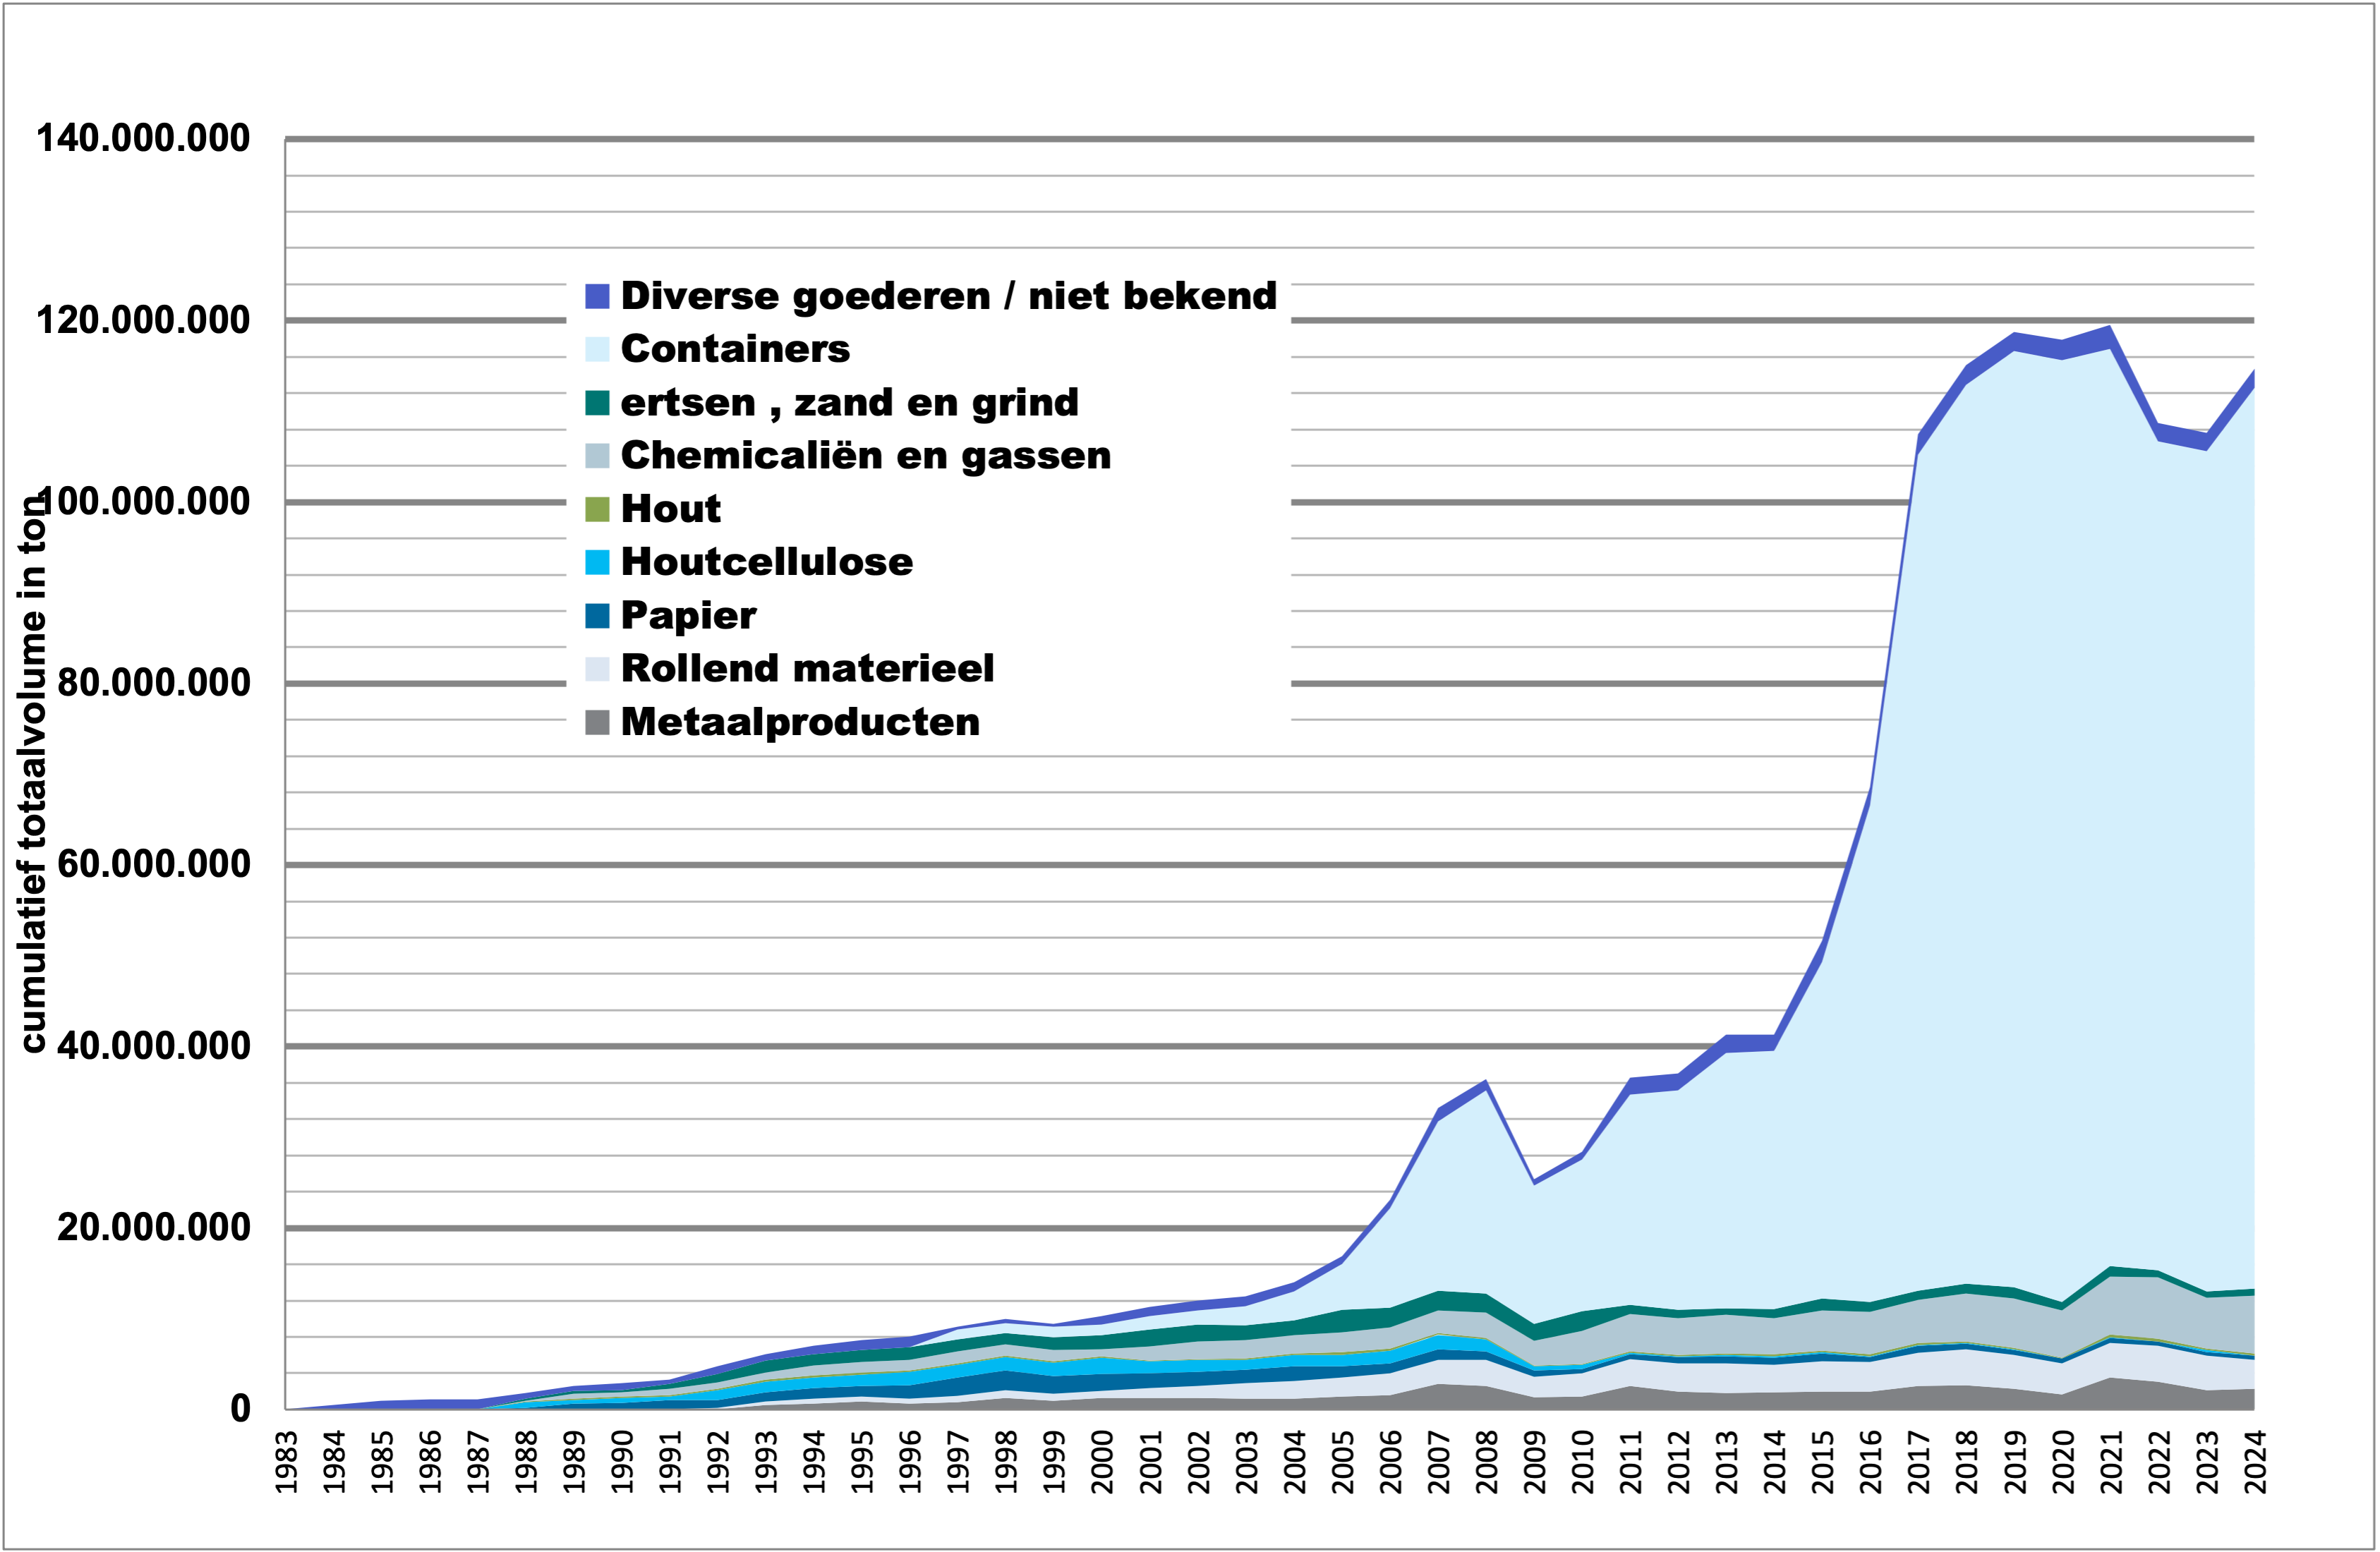
Goederen per soort (Waaslandhaven) / Goods per type (left bank)
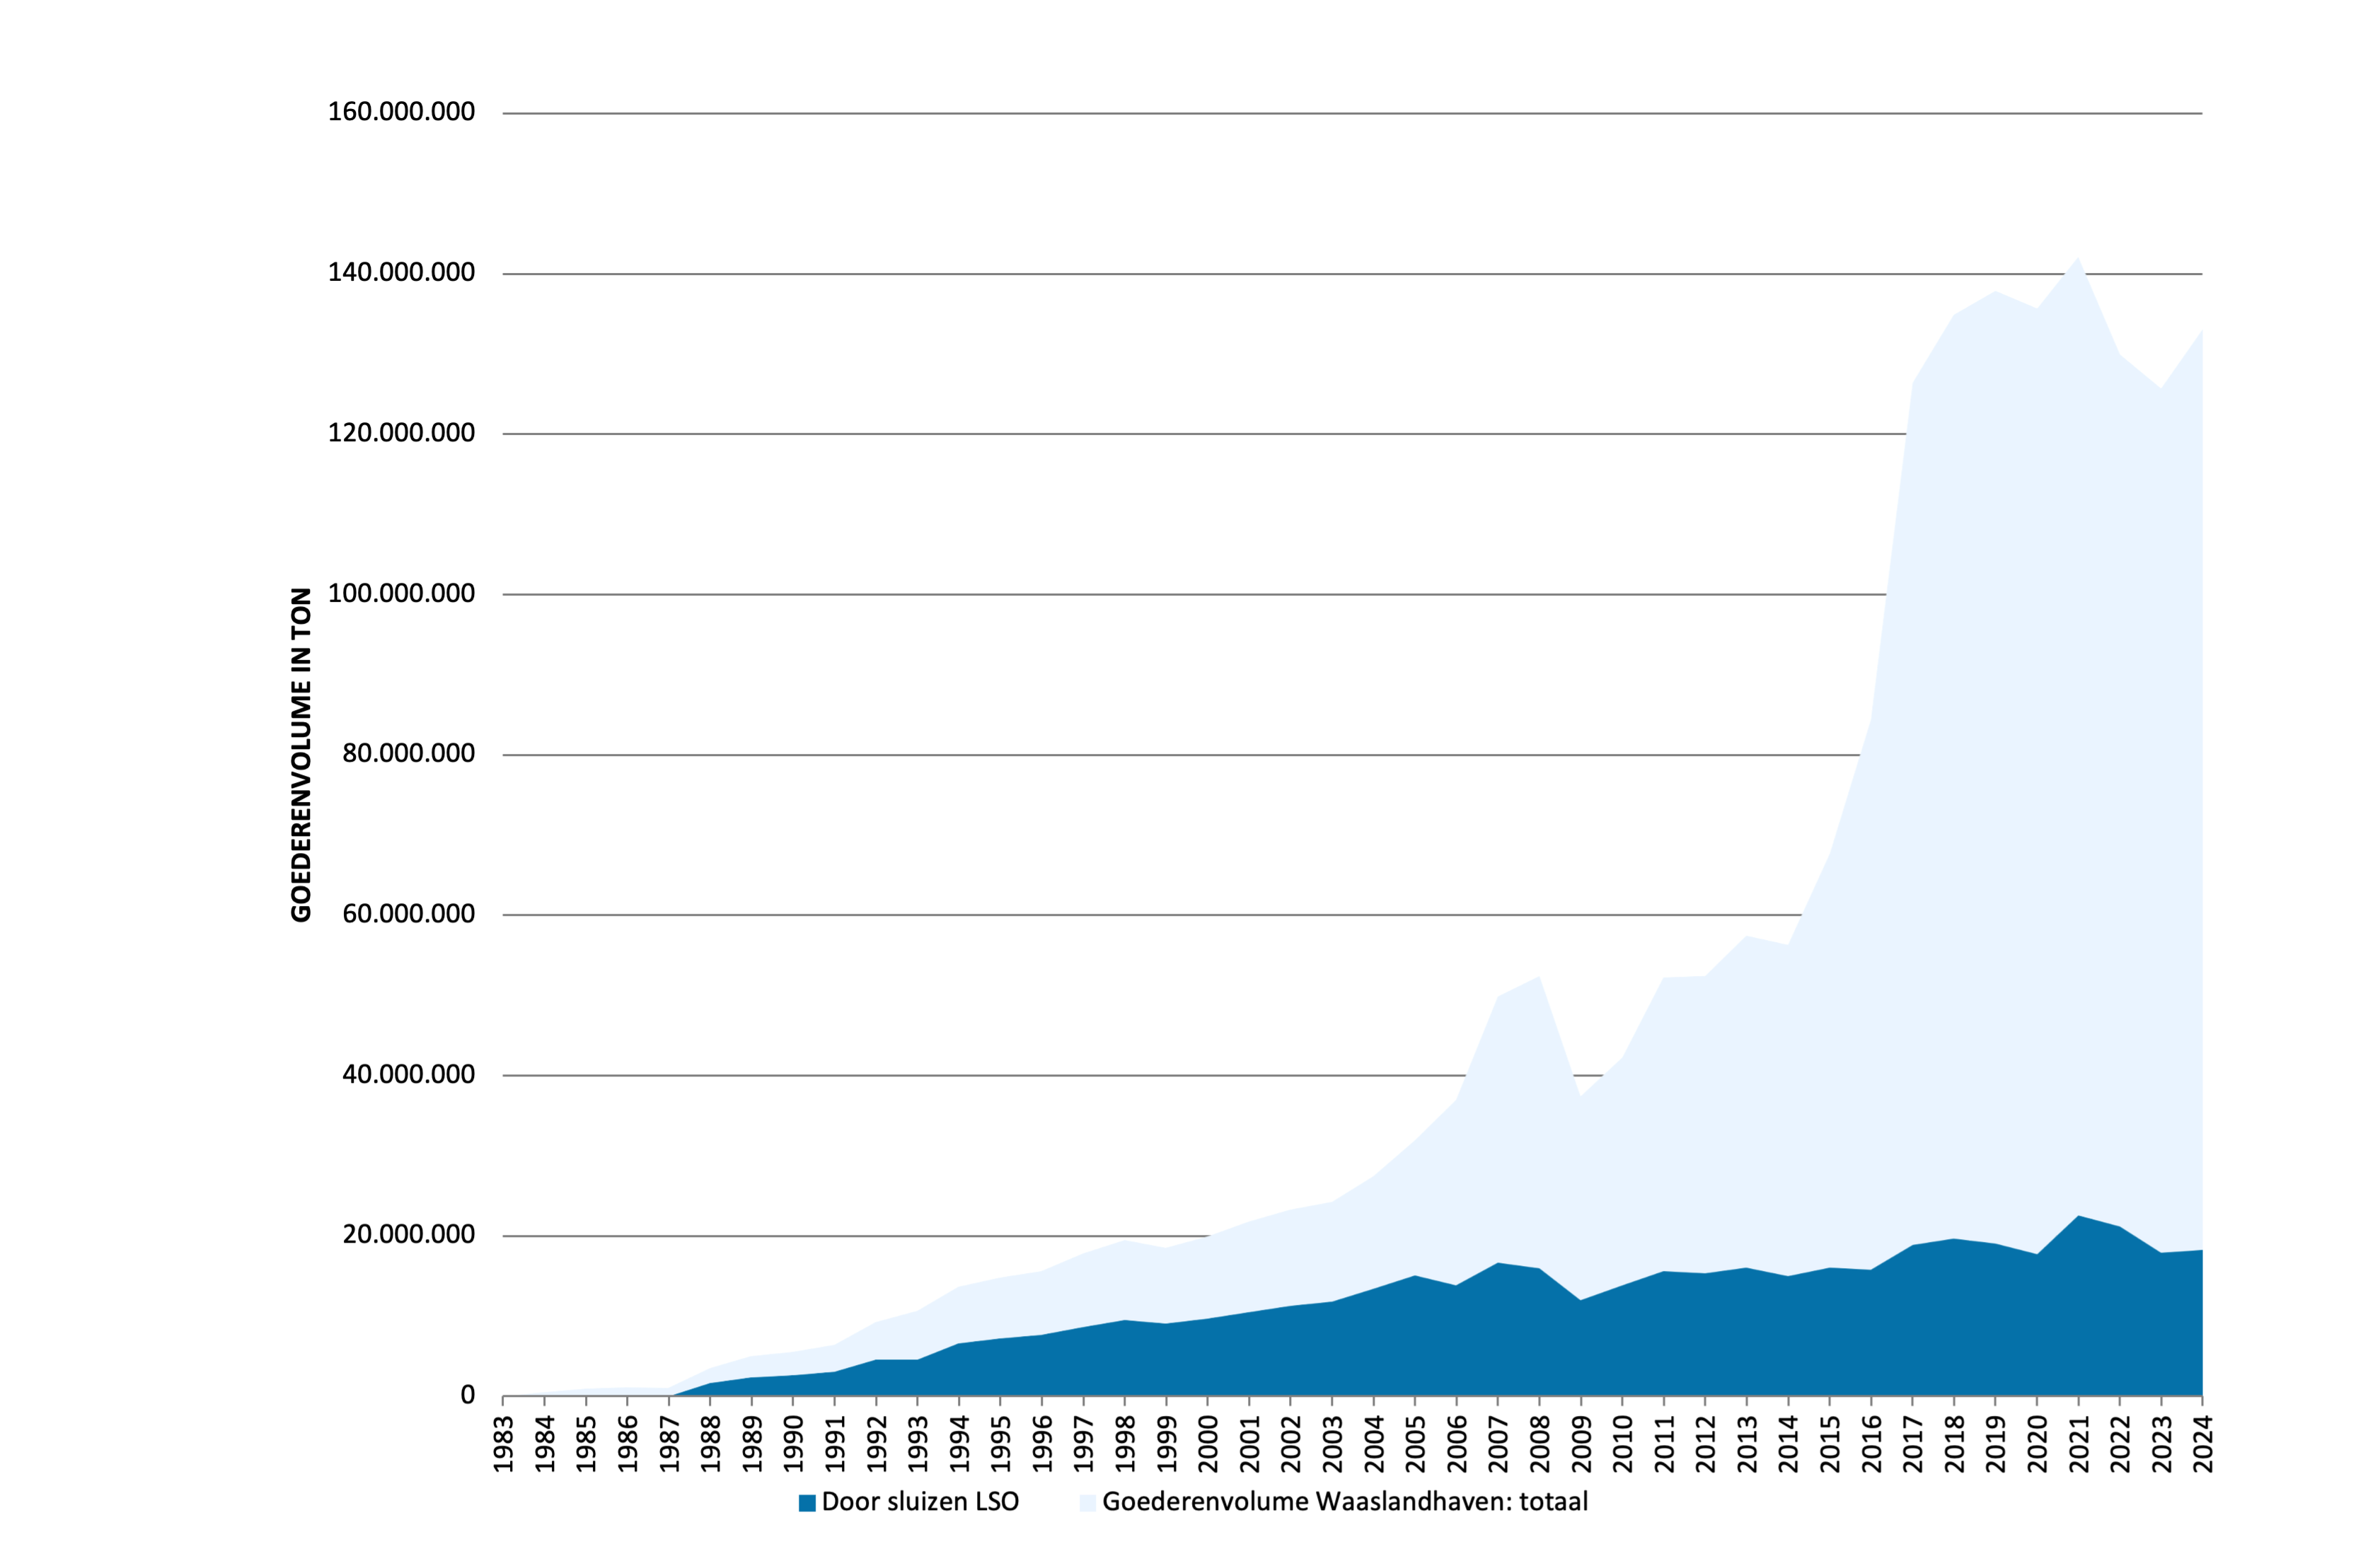
Maritieme goederen (in ton) door sluizen linker-Scheldeoever en totaal / Maritime goods (in tonnes) via left bank locks and total
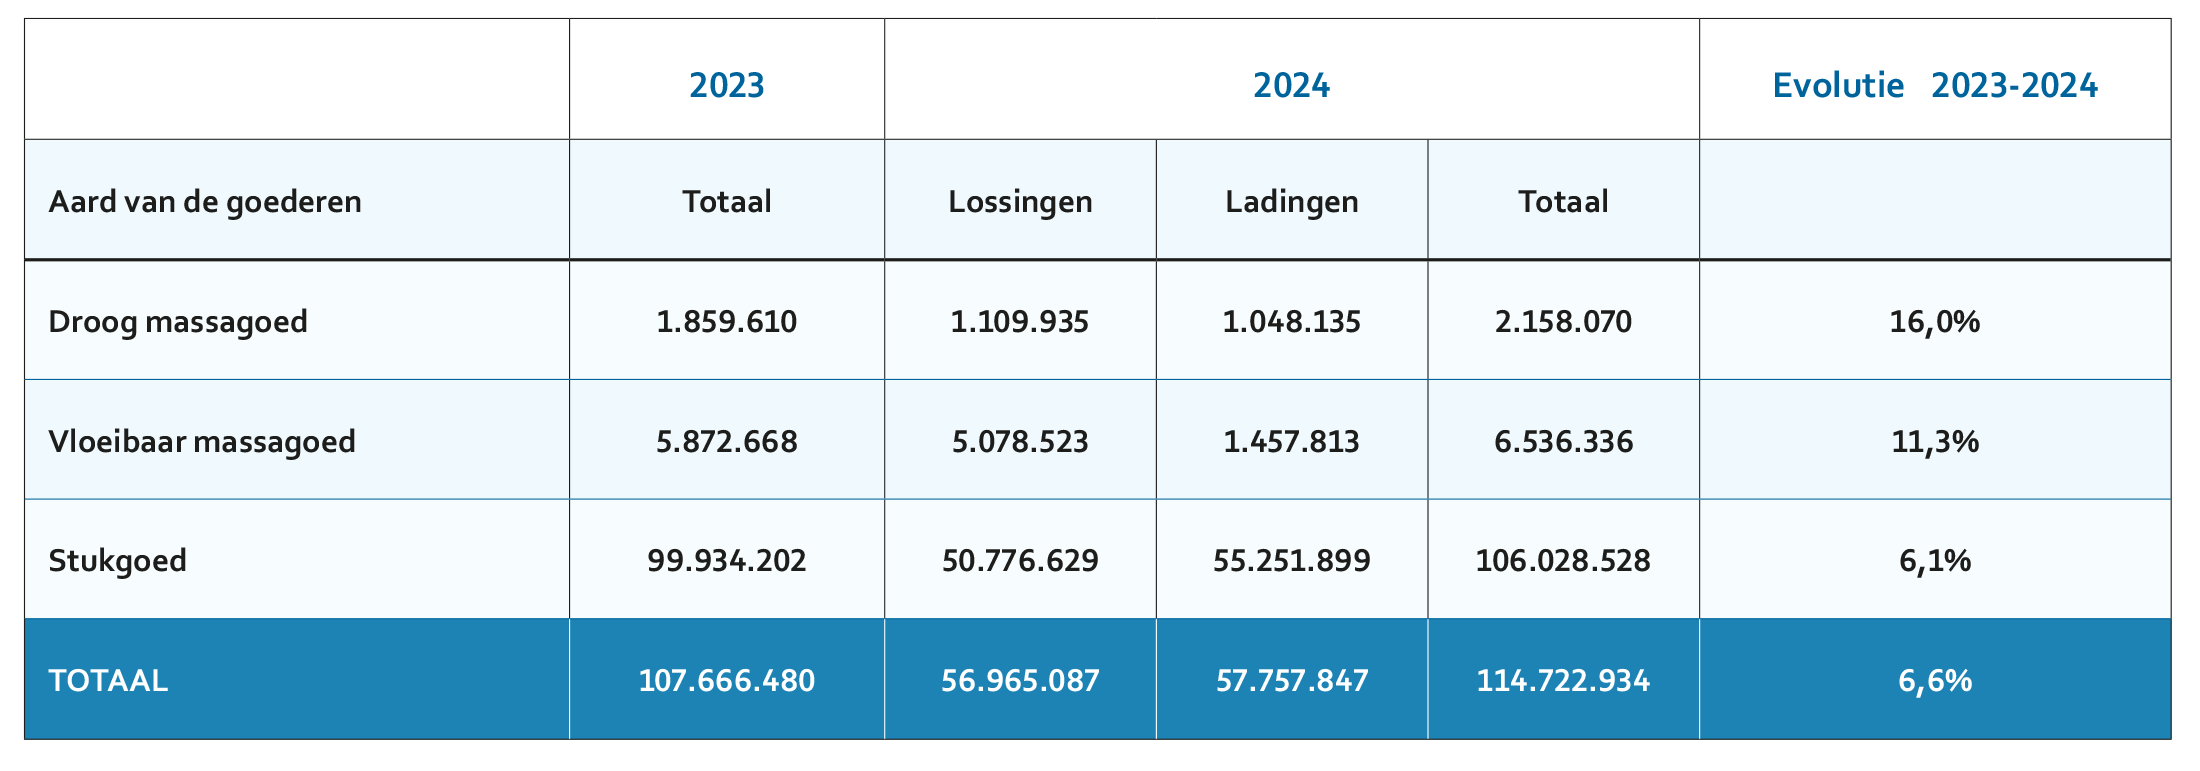
Maritieme trafiek Waaslandhaven volgens aard van de goederen (in ton) / left bank: Maritime traffic according to type of goods (tonnes)
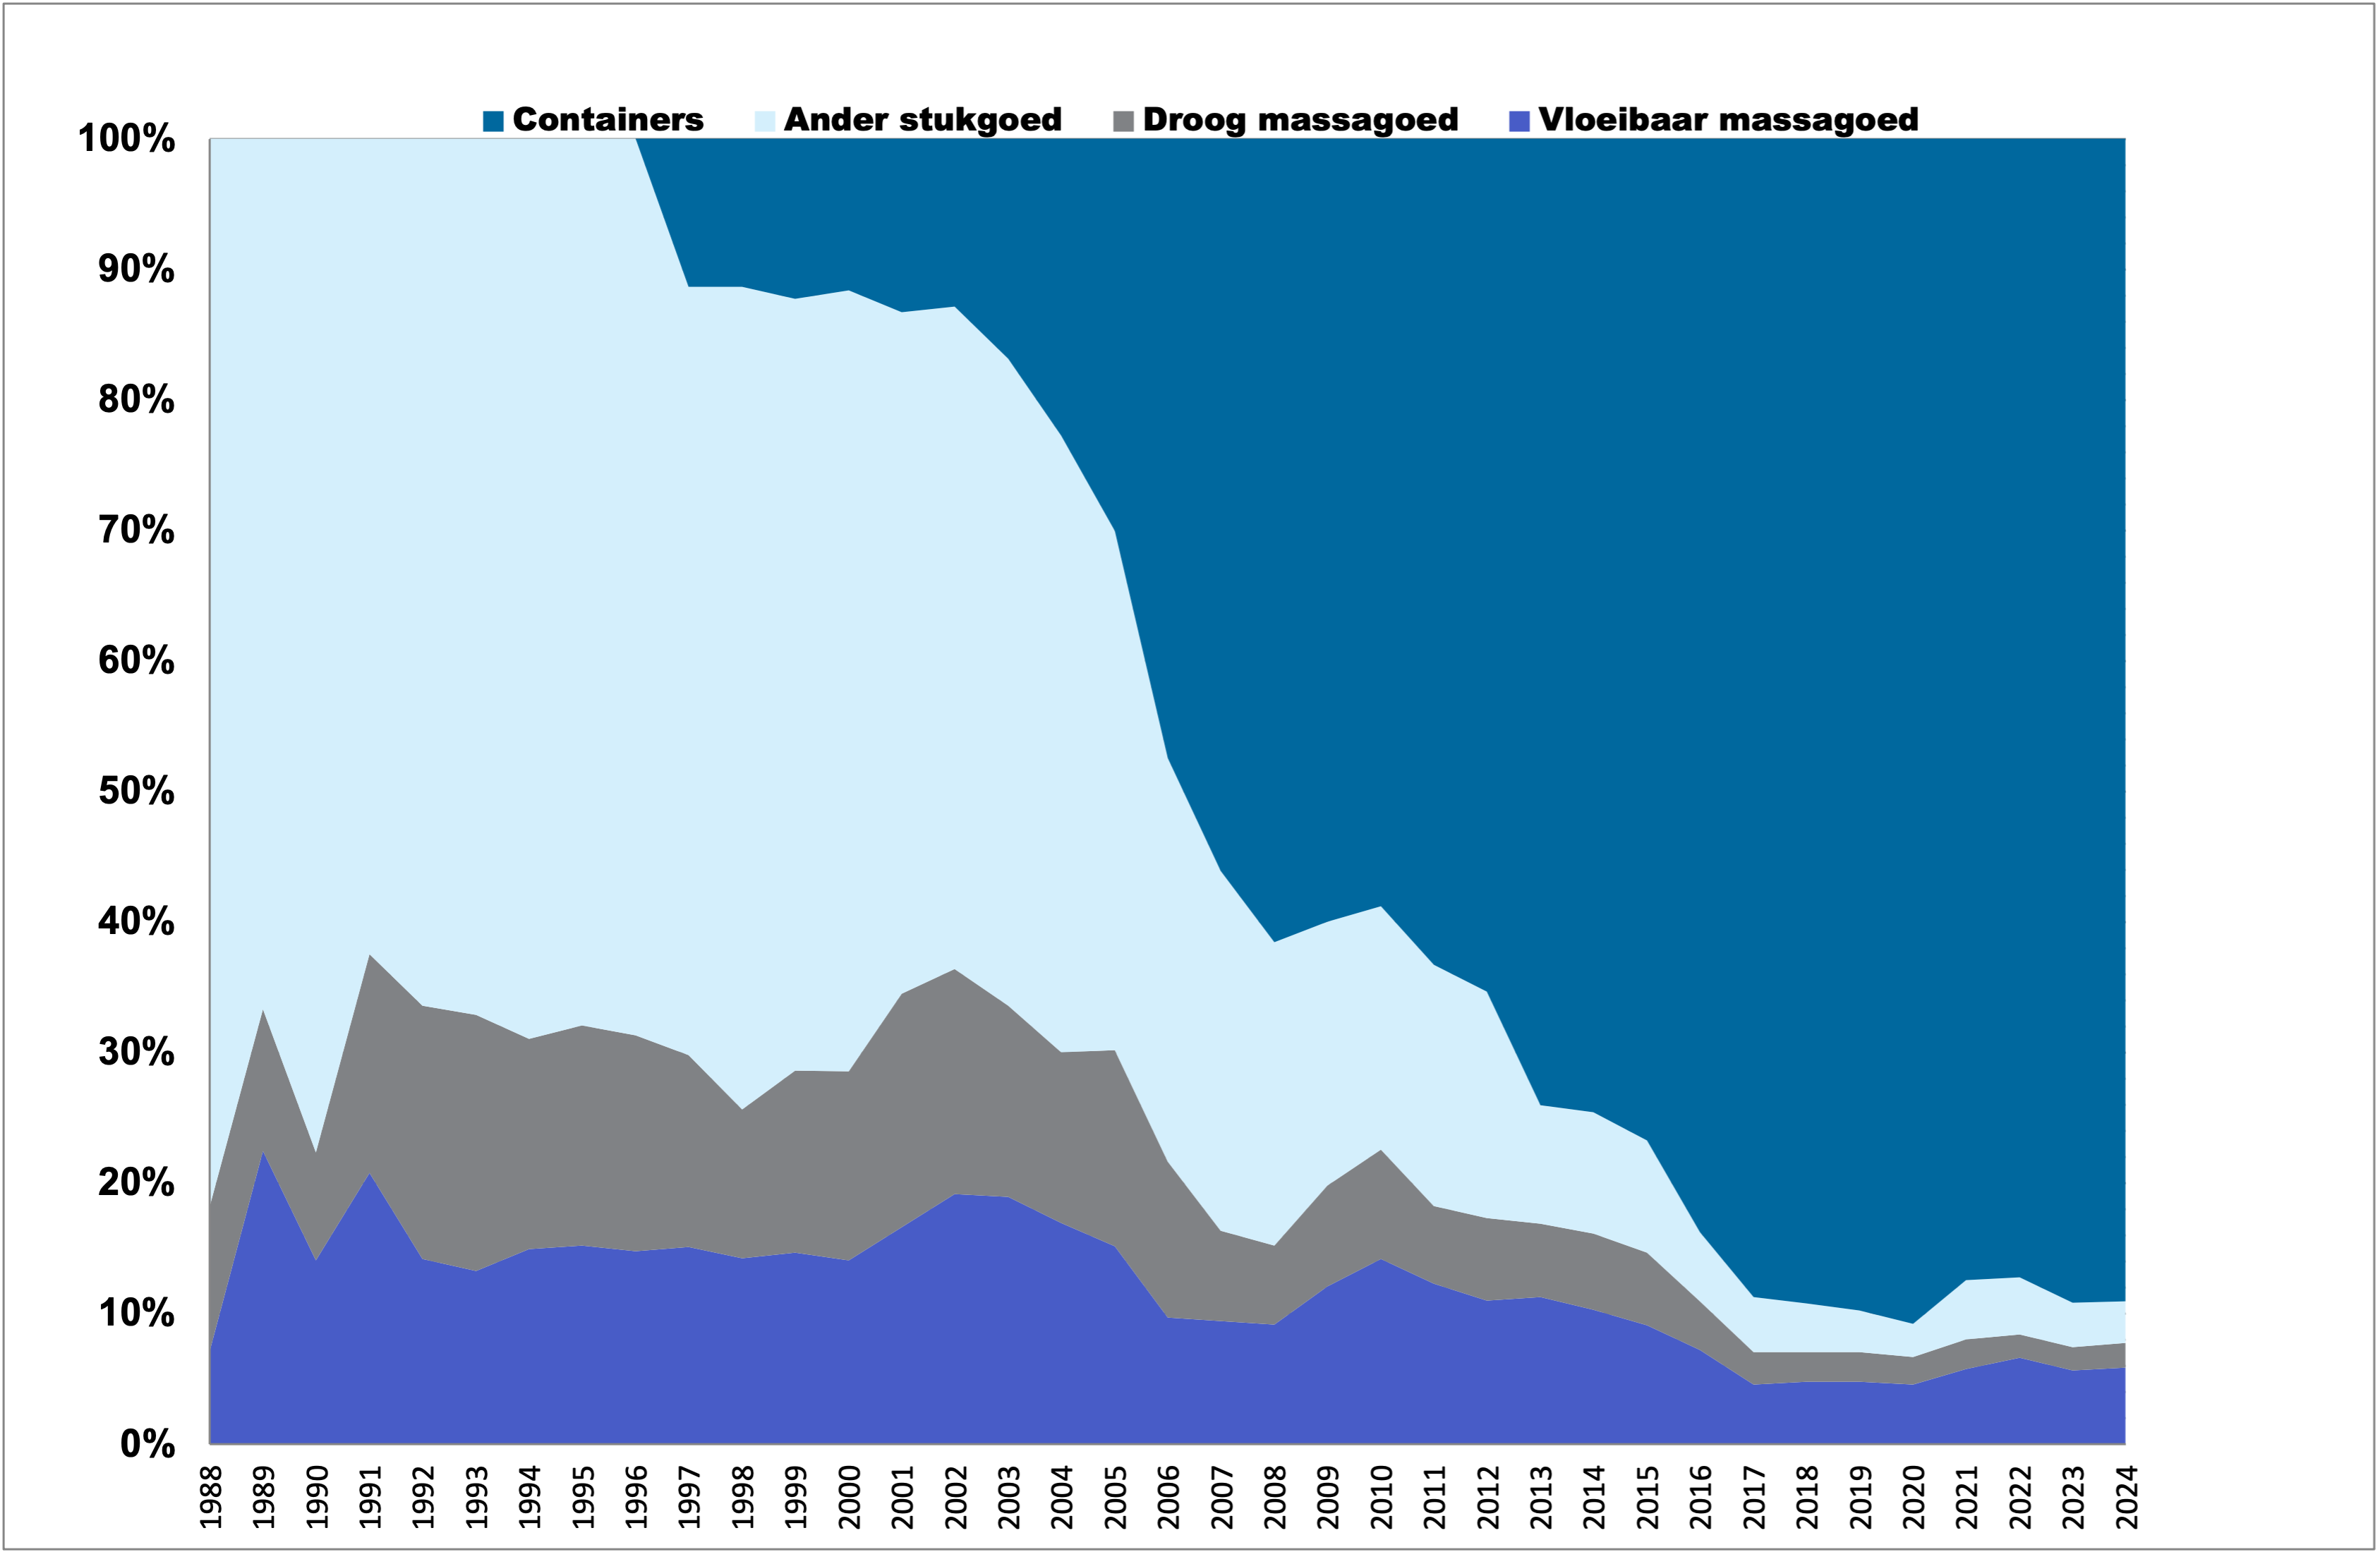
Procentueel verloop goederen per aard (Waaslandhaven) / Percentage of movement of goods per type (left bank)
Totaal goederen volume in ton (Waaslandhaven) / Total goods by volume in tonnes (left bank)
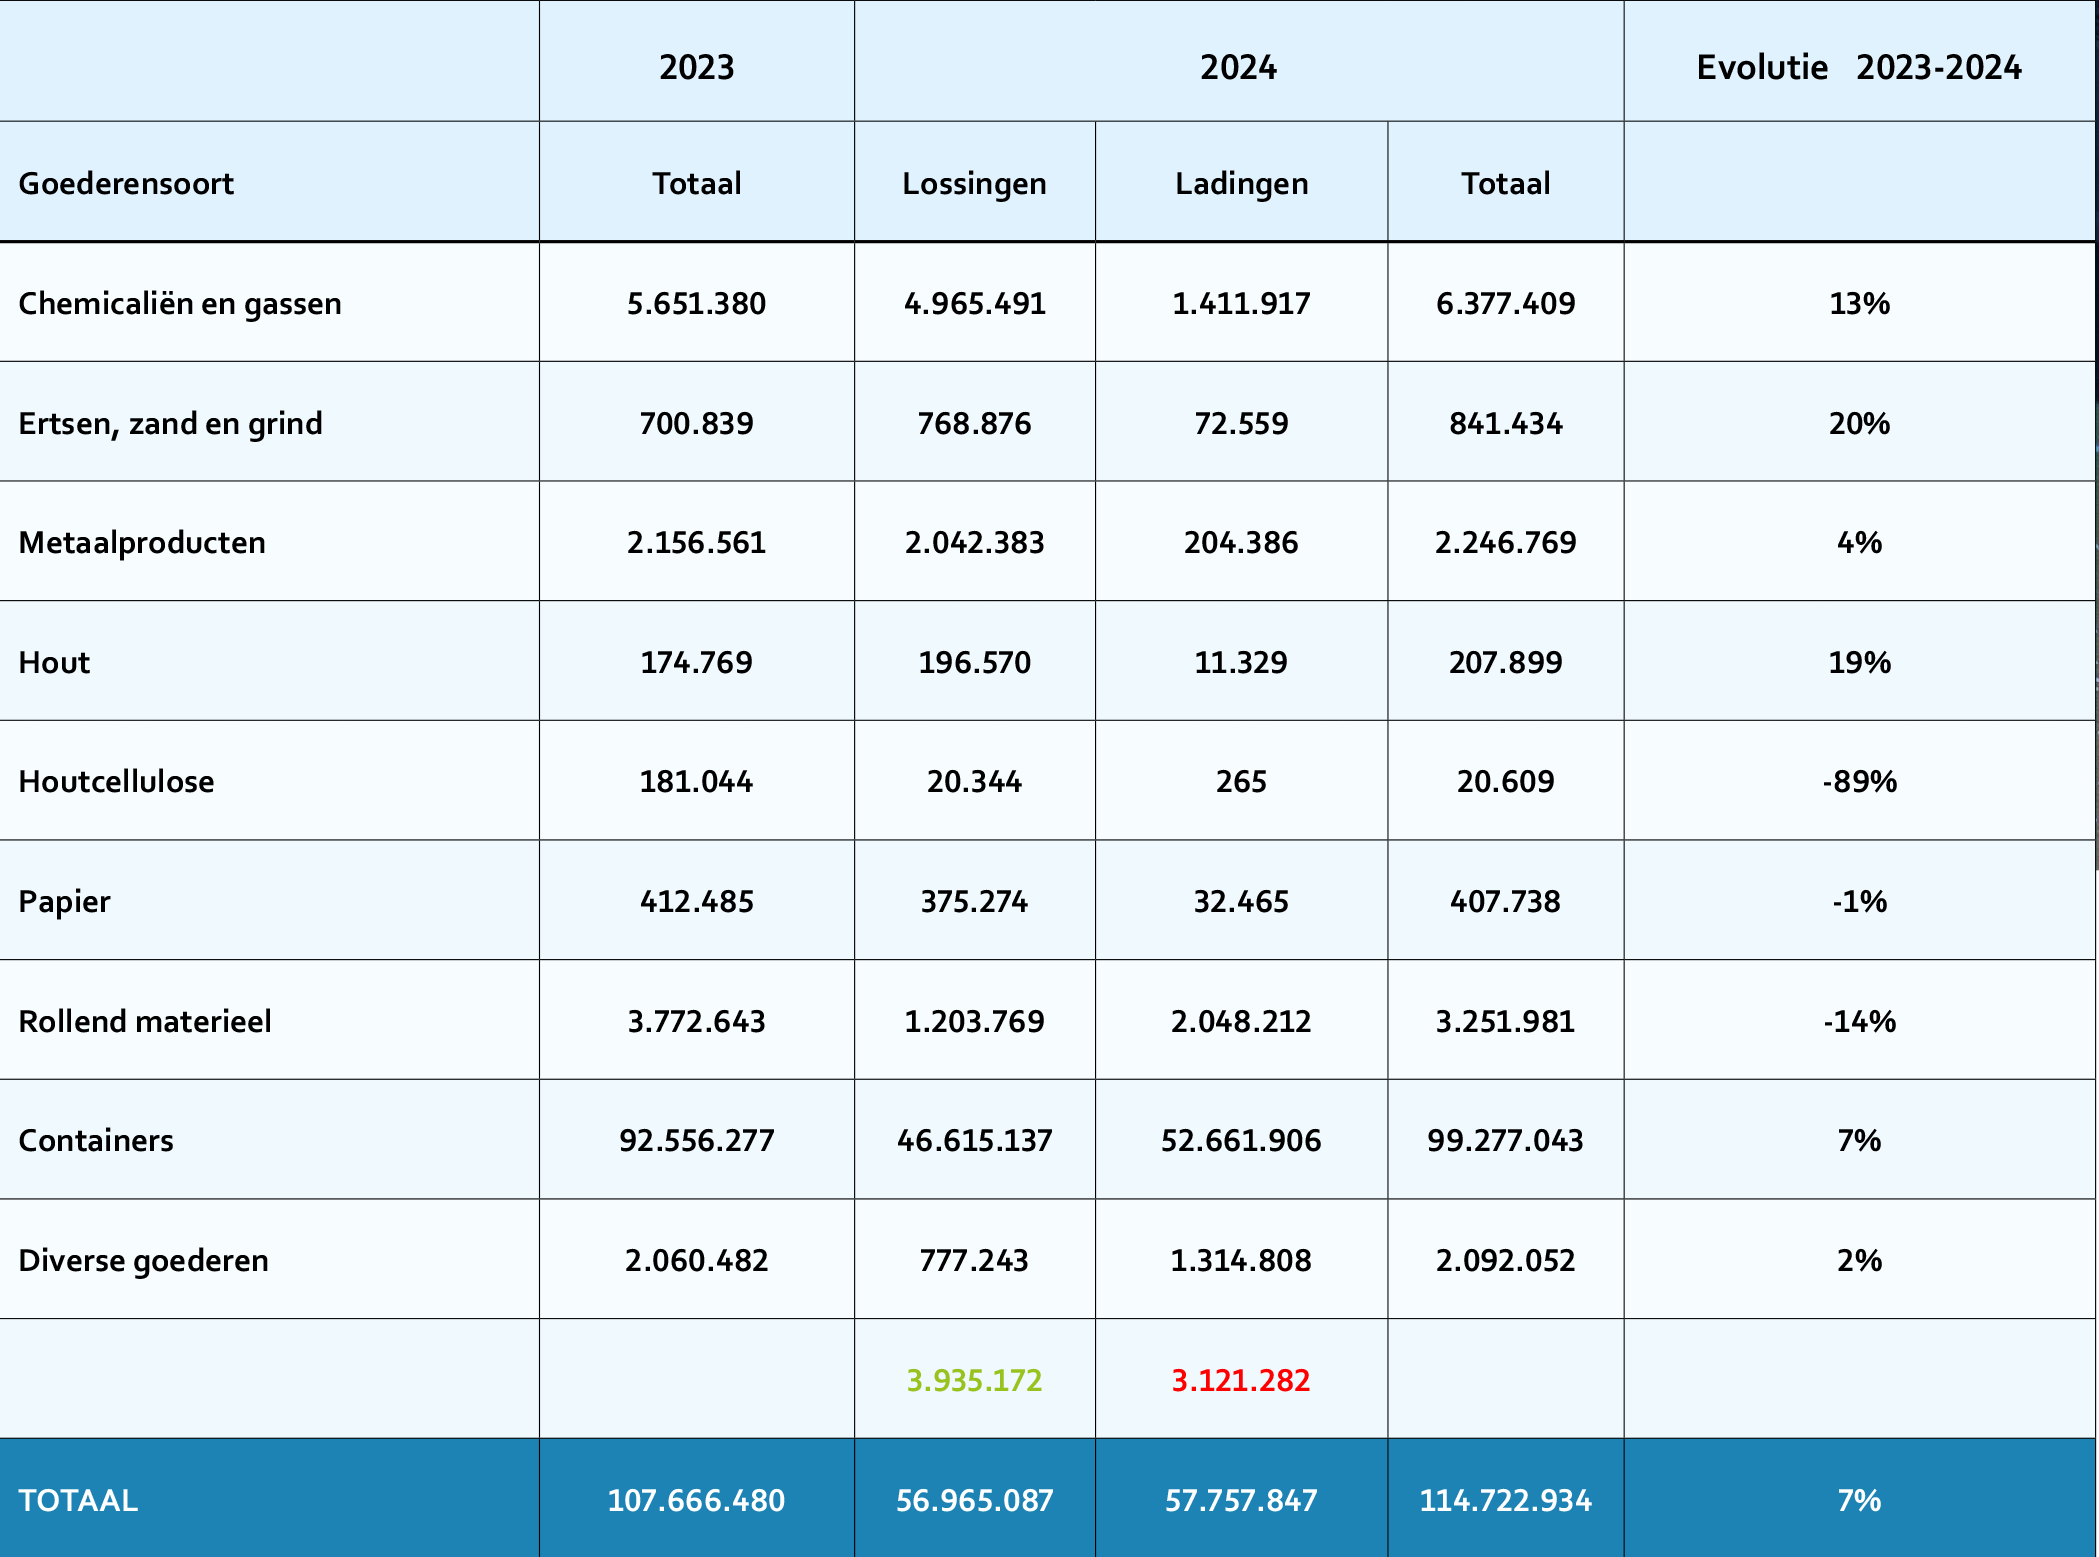
Trafiek Waaslandhaven per goederensoort (ton) / left bank: traffic per goods type (tonnes)
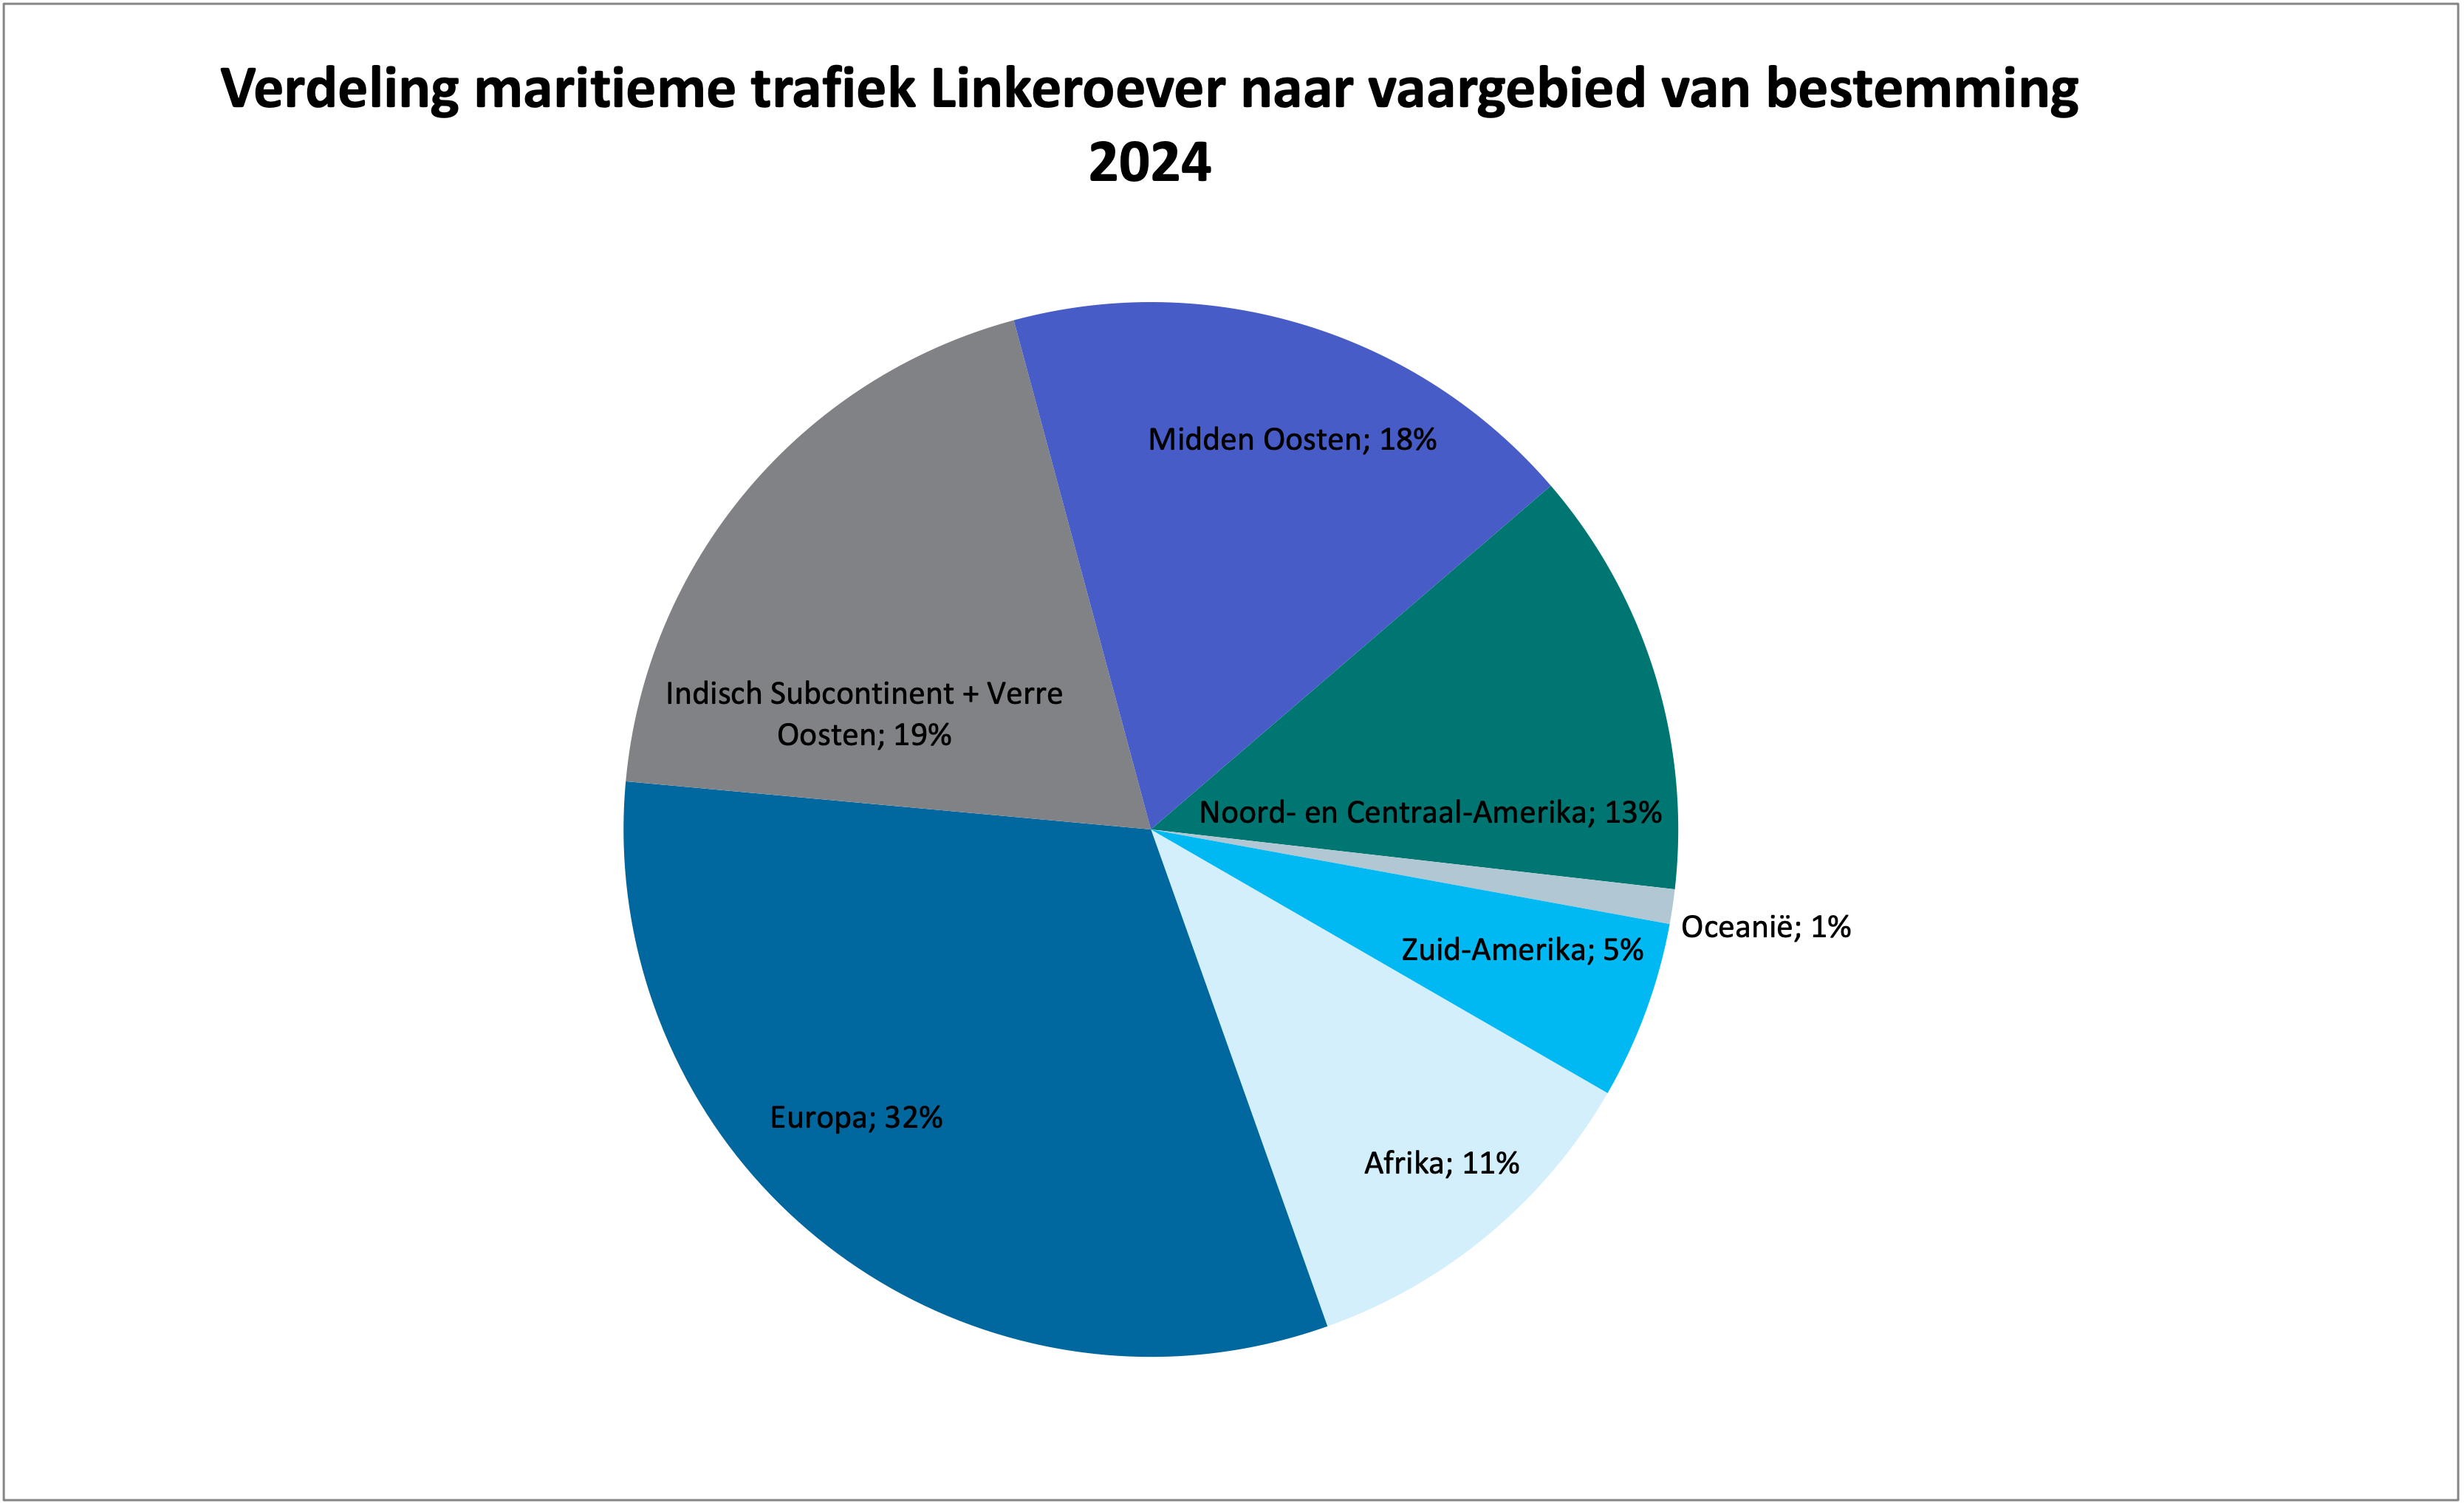
Verdeling maritieme trafiek vaargebied bestemming / Distribution of left bank Maritime traffic to shipping area of destination
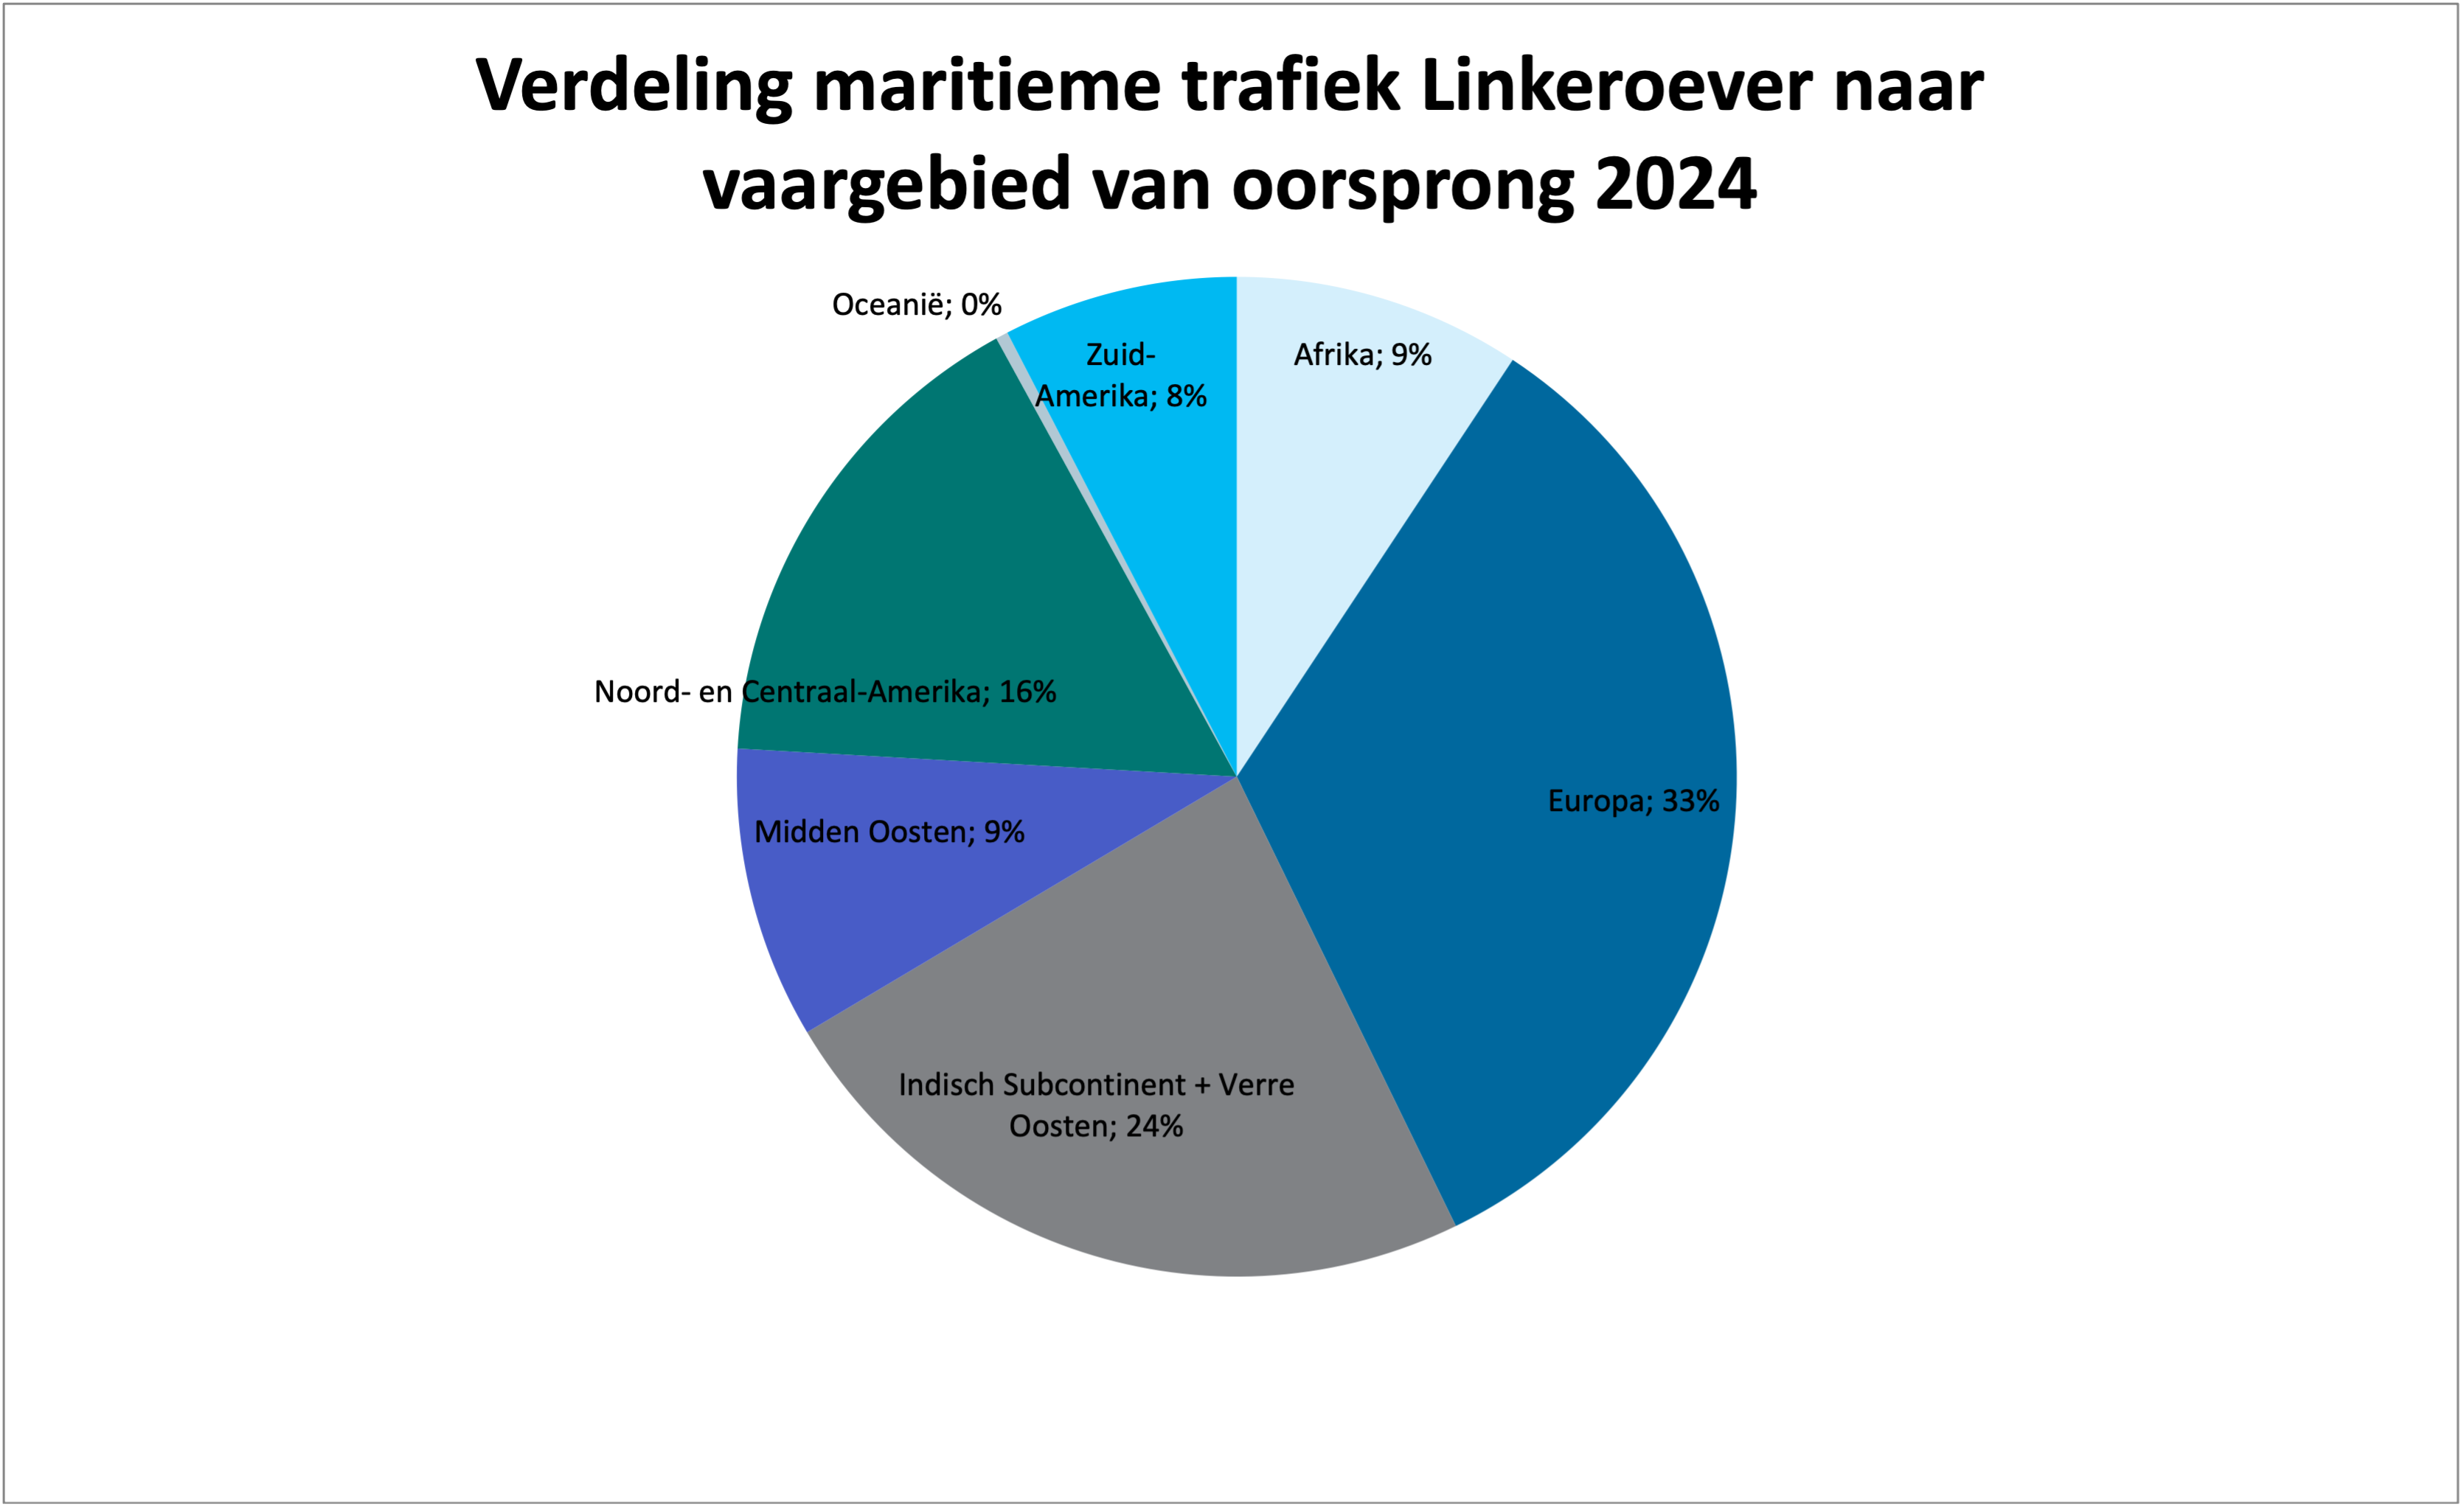
Verdeling maritieme trafiek vaargebied oorsprong / Distribution of left bank Maritime traffic to shipping area of origin
Zeegoederen volume per aard (Waaslandhaven) / Seagoing goods volume per type (left bank)
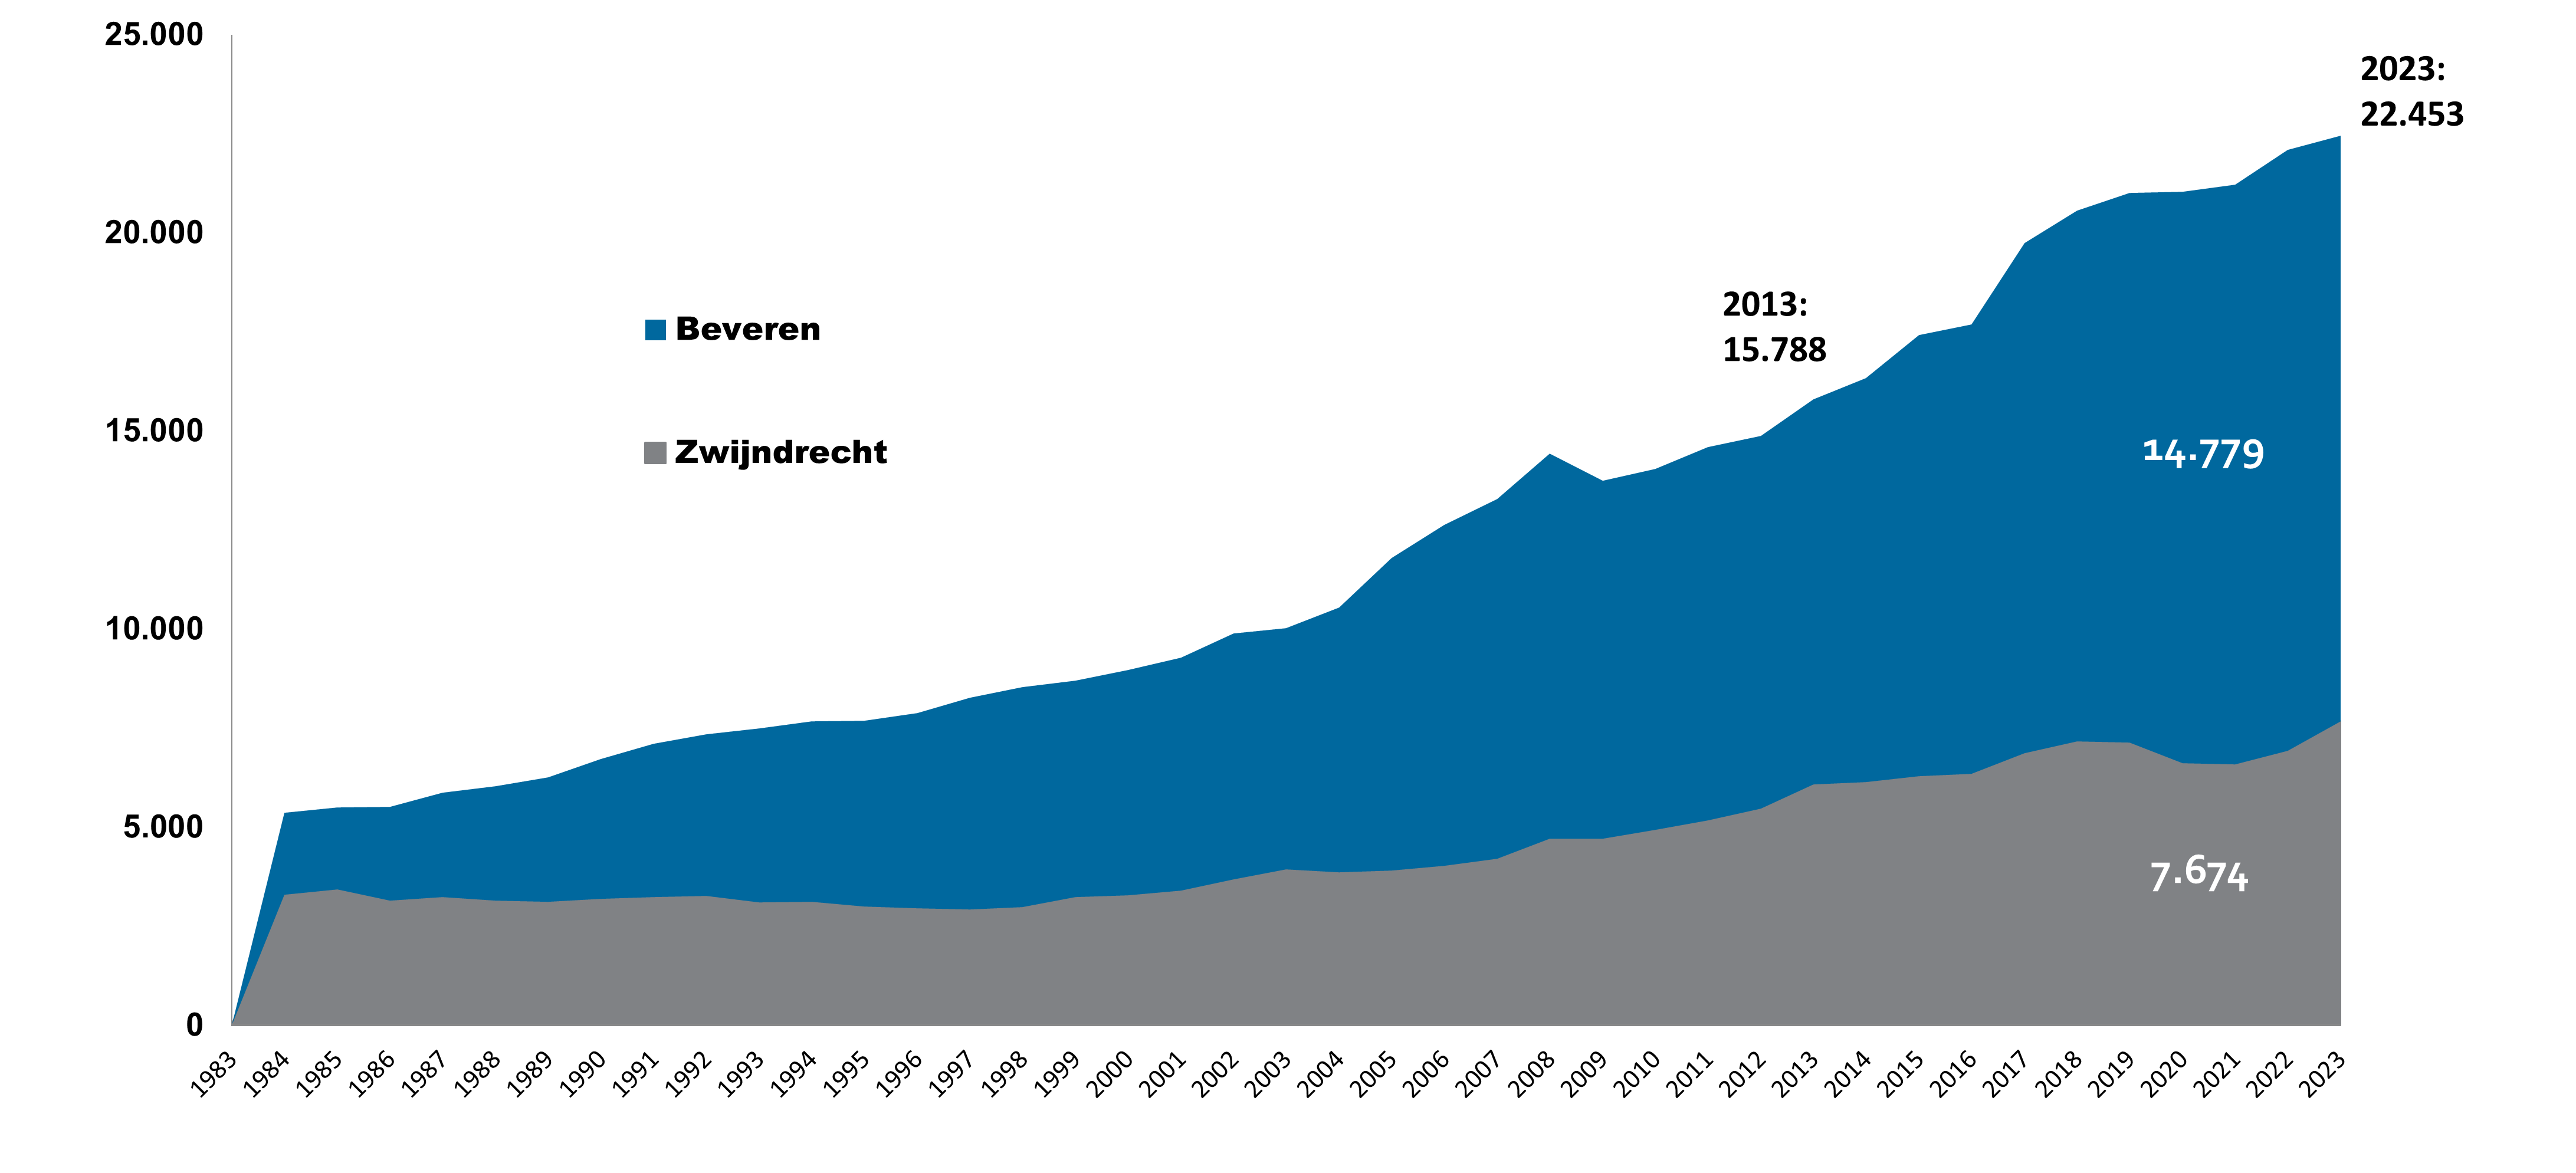
MLSO key indicators: directly employed at the port on the left bank of the Scheldt in 2023
At the end of 2023, the port on the left bank of the Scheldt – according to the annual survey – employed 22,453 FTEs (full-time equivalents, direct employment). 7,674 FTEs work in Zwijndrecht. 14,779 FTEs work in Beveren. The number reaches 25,035 people when contractors are included. We consider the group of contractors to be ‘indirectly employed’. Other forms of indirect employment include transporters, suppliers, security officers, gardeners, catering staff, and so on.
To estimate the number of the indirectly employed at the Port of Antwerp, the National Bank of Belgium (NBB) calculated with a factor of direct employment x 1.26 (latest available factor is for balance sheet figures for 2020). With this as a basis, the estimated total employment at the port on the left bank of the Scheldt will increase from 49,913 FTE in 2022 to 50,743 FTE in 2023.
Directe tewerkstelling (vte) / Direct employment (FTE)
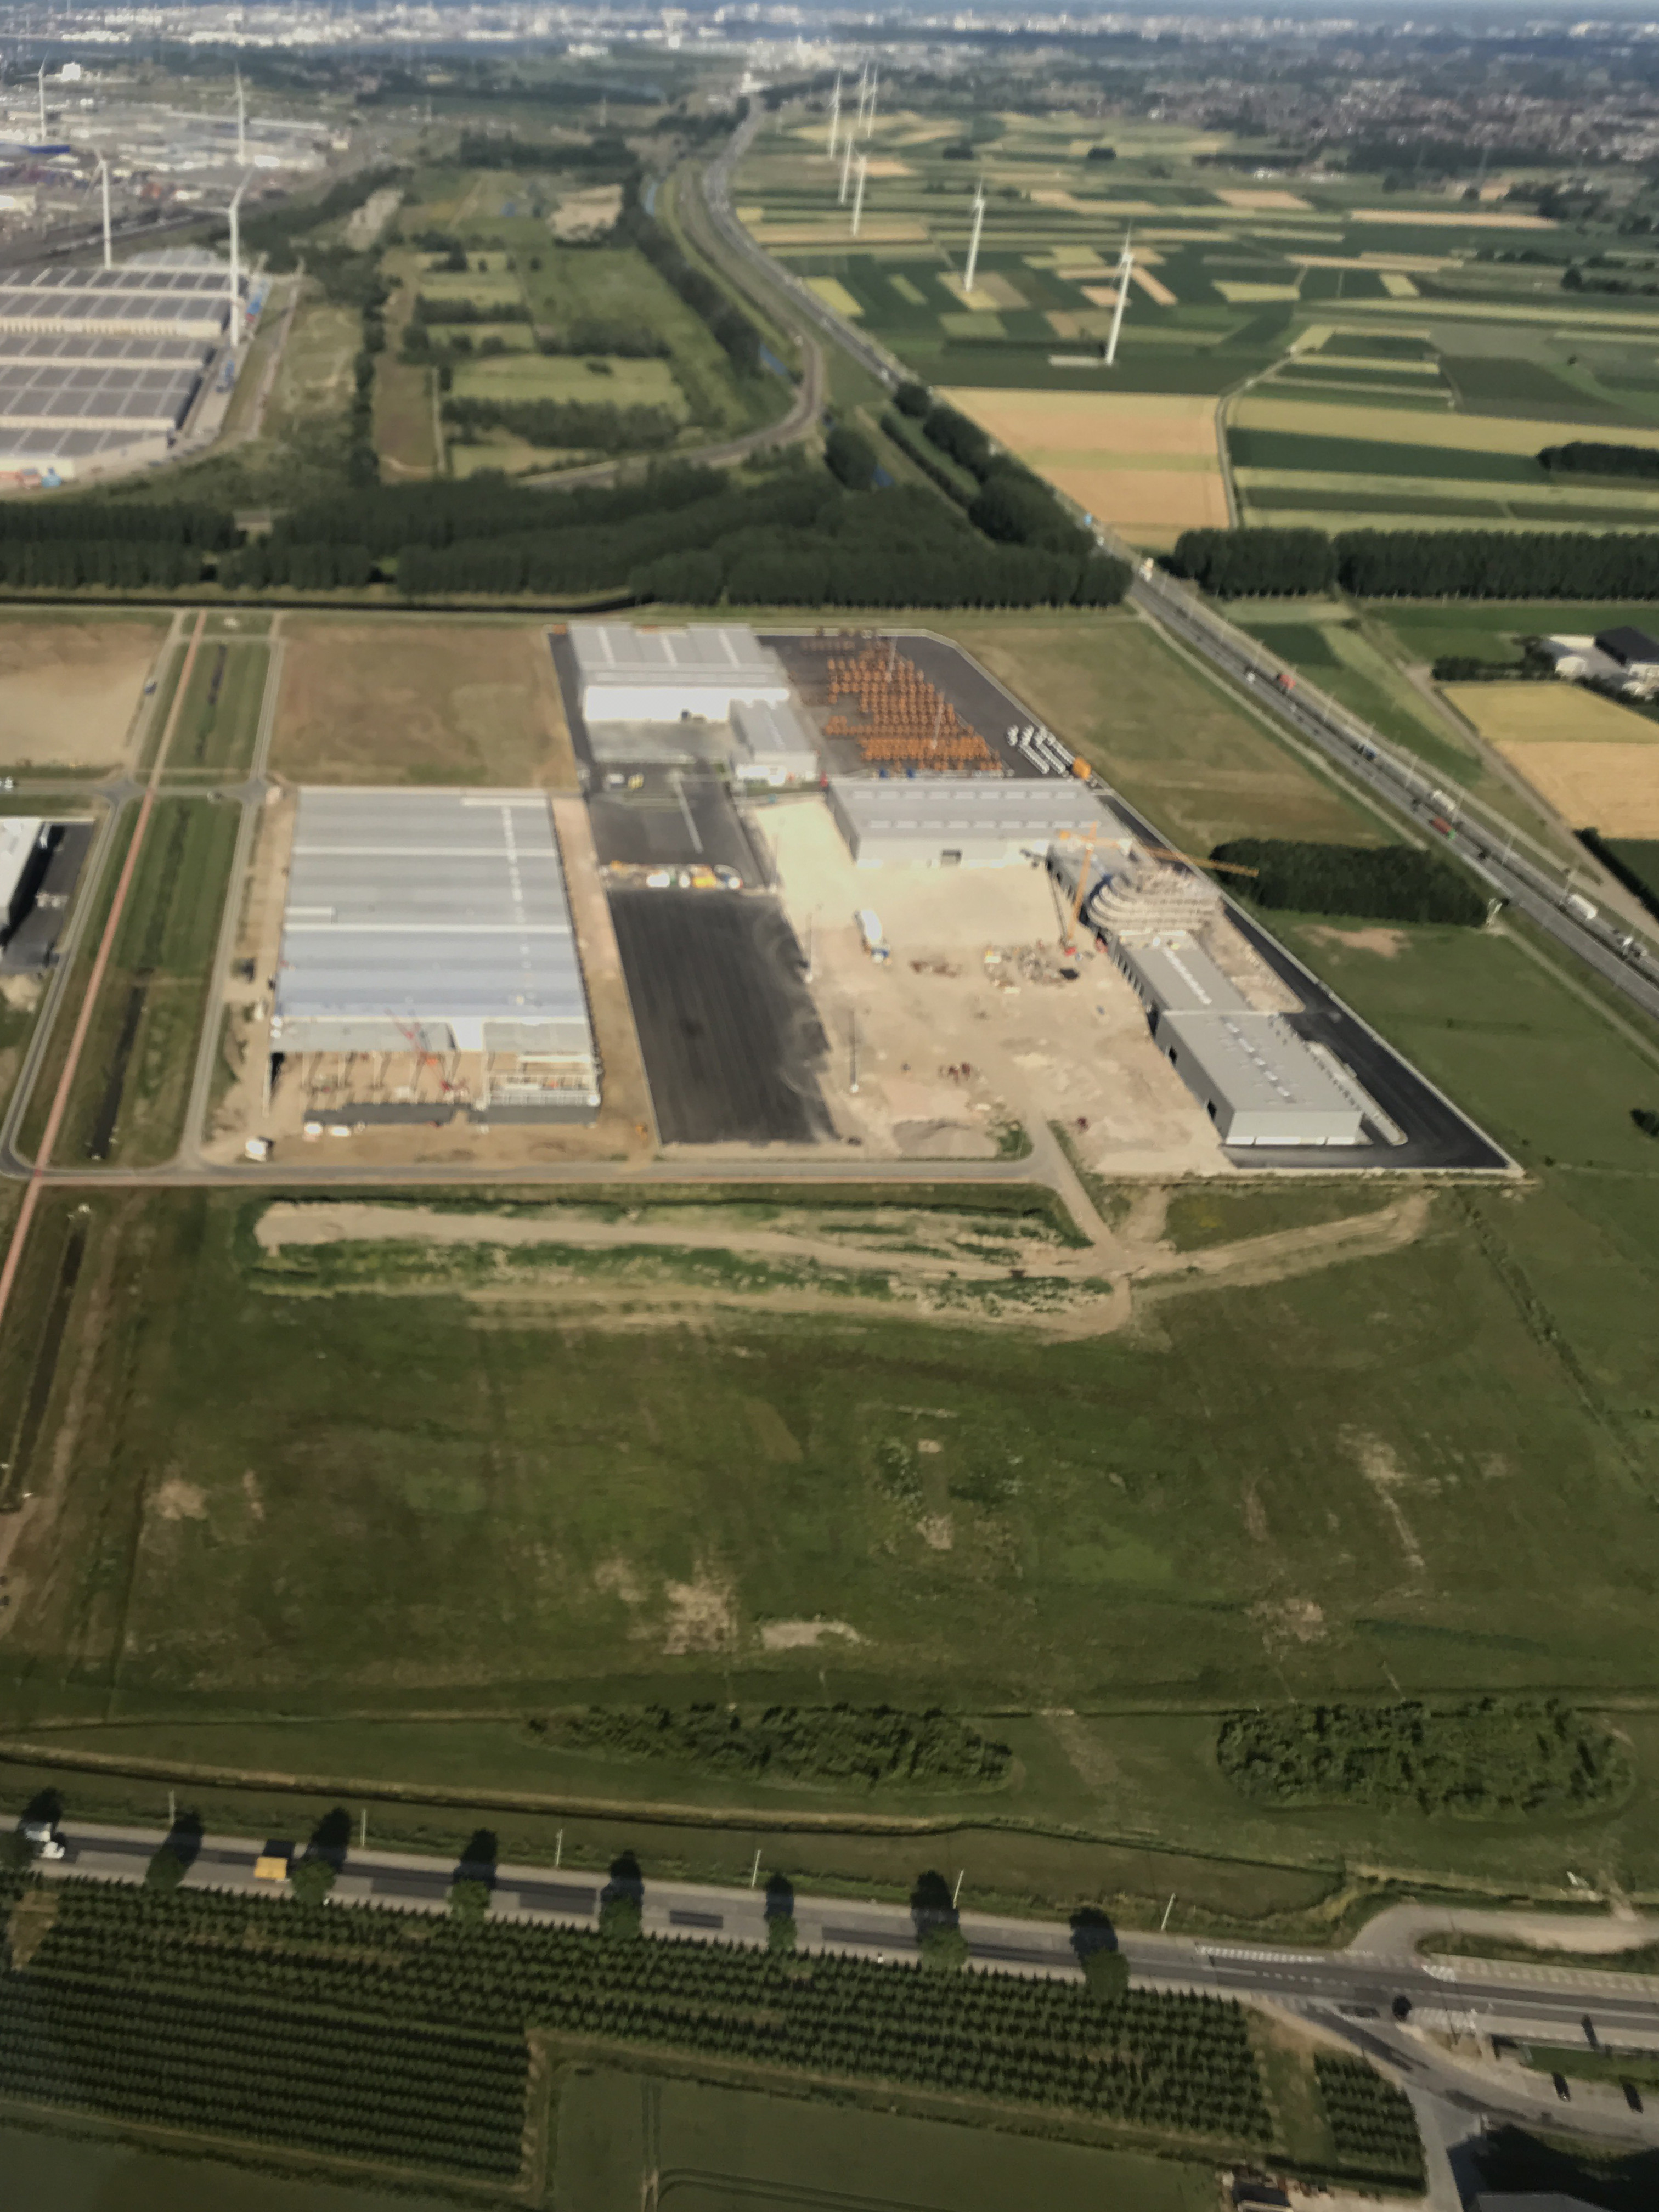
Waasland Logistics Park business park management
Mobility Environment Economics
In 2017, business park management was initiated for the western part of the Waasland Logistics Park. Participation in business park management is one of the conditions that must be satisfied to be...
Community consultation association
Mobility Environment Economics
Currently, the Ketenislaan, Molenweg, Geslecht, Deurganckdok, and Sint-Jansweg zone only has one community consultation association for companies at the port on the left bank of the Scheldt. It was...